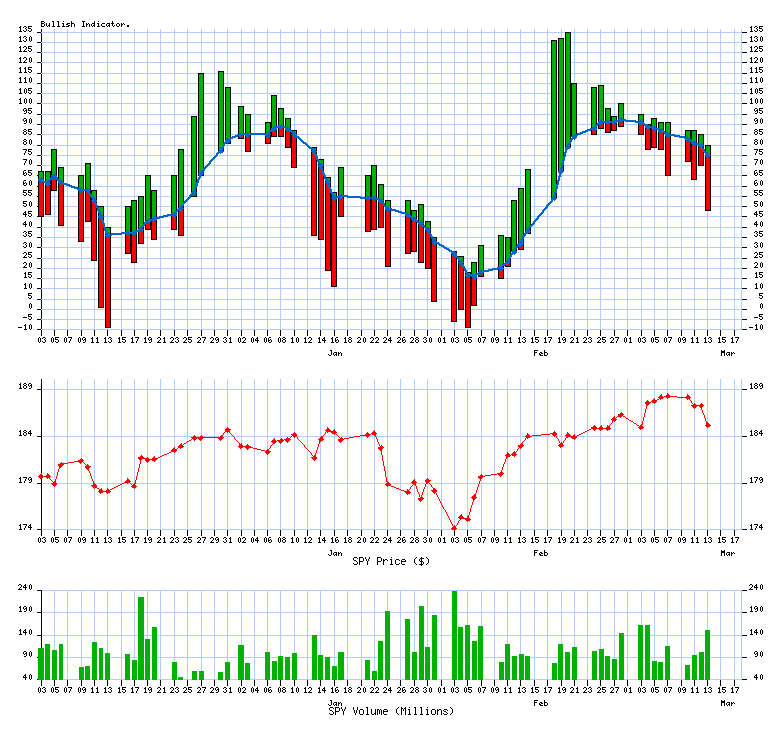
| 75% are trading Bullish (Above 10/20 SMA) | ||||||||
| last successfully ran 3/13/2014 at 04:05 PM | ||||||||
| Upward direction stocks | ||||||||
Description | Symbol | StockTA | Yahoo | News | ||||
AvalonBay Communities | AVB | StockTA | Yahoo | News | ||||
Quest Diagnostics Inc | DGX | StockTA | Yahoo | News | ||||
McDonald's Corporatio | MCD | StockTA | Yahoo | News | ||||
McGraw Hill | MHFI | StockTA | Yahoo | News | ||||
The Southern Company | SO | StockTA | Yahoo | News | ||||
| Downward direction stocks | ||||||||
Description | Symbol | StockTA | Yahoo | News | ||||
Adobe Systems Incorpo | ADBE | StockTA | Yahoo | News | ||||
Akamai Technologies, | AKAM | StockTA | Yahoo | News | ||||
Avon Products, Inc. | AVP | StockTA | Yahoo | News | ||||
Biogen Idec Inc. | BIIB | StockTA | Yahoo | News | ||||
Boston Scientific Cor | BSX | StockTA | Yahoo | News | ||||
Peabody Energy Corpor | BTU | StockTA | Yahoo | News | ||||
Caterpillar Inc. | CAT | StockTA | Yahoo | News | ||||
Cerner Corporation | CERN | StockTA | Yahoo | News | ||||
Costco Wholesale Corp | COST | StockTA | Yahoo | News | ||||
Computer Sciences Cor | CSC | StockTA | Yahoo | News | ||||
D.R. Horton, Inc. | DHI | StockTA | Yahoo | News | ||||
Danaher Corporation | DHR | StockTA | Yahoo | News | ||||
Consolidated Edison, | ED | StockTA | Yahoo | News | ||||
Google Inc | GOOG | StockTA | Yahoo | News | ||||
Intel Corporation | INTC | StockTA | Yahoo | News | ||||
Kimberly Clark Corp | KMB | StockTA | Yahoo | News | ||||
NVIDIA Corporation | NVDA | StockTA | Yahoo | News | ||||
Newell Rubbermaid Inc | NWL | StockTA | Yahoo | News | ||||
Public Service Enterp | PEG | StockTA | Yahoo | News | ||||
PulteGroup, Inc. | PHM | StockTA | Yahoo | News | ||||
SanDisk Corporation | SNDK | StockTA | Yahoo | News | ||||
St. Jude Medical, Inc | STJ | StockTA | Yahoo | News | ||||
Stanley Black & Decke | SWK | StockTA | Yahoo | News | ||||
Symantec Corporation | SYMC | StockTA | Yahoo | News | ||||
Teradyne, Inc. | TER | StockTA | Yahoo | News | ||||
Exxon Mobil Corporati | XOM | StockTA | Yahoo | News | ||||
Xylem Inc | XYL | StockTA | Yahoo | News | ||||
Bullish comma separated list (upfile.txt) | ||||||||
Bearish comma separated list (downfile.txt) | ||||||||
| ||||||||
VIX Indicator | ||||||||
VIX Value (03/12/2014) = 14.47 | ||||||||
| 4 year historical Low | 4 year historical High | |||||||
| 11.05 | 48.00 | |||||||
Distribution Charts | |
The current value is: 75 | |
| the median value: 63 | the median value: 61 |
| 4.0 Years | 364 Past Calendar Days |
Trending Charts (Winning / Losing Streak) | |
The chart has been trending down for 9 days | |
| 4.0 Years | 364 Past Calendar Days |
__._,_.___
<*> To unsubscribe from this group, send an email to:
brian@coxintl.com
| xsProfits Website | Investools | Think Or Swim |
| 10/20 day MA daily table | 10/20 MA Breakout | Bullish Percent Index |
__,_._,___
No comments:
Post a Comment