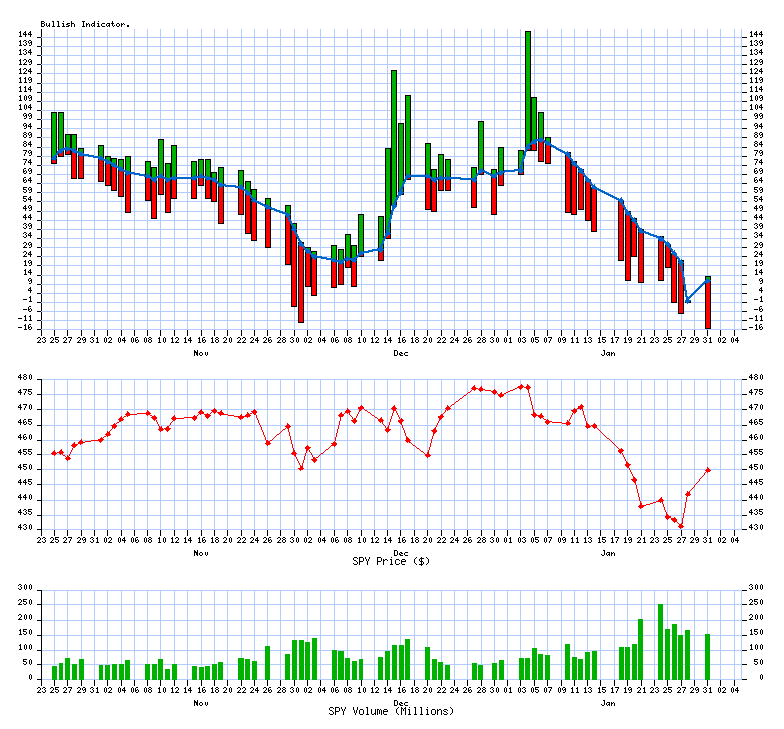
Monday, January 31, 2022

Daily xs Indicator Report (beta)

11% are trading Bullish (Above 10/20 SMA)
last successfully ran 01/31/2022 at 06:11 PM
Upward direction stocks

Description

 Symbol StockTA Yahoo News

CME Group Inc

 CME  StockTA   Yahoo   News

McCormick & Company,

 MKC  StockTA   Yahoo   News
 
Downward direction stocks

Description

 Symbol StockTA  Yahoo News

American Electric Pow

  AEP   StockTA   Yahoo   News

Amgen, Inc.

  AMGN   StockTA   Yahoo   News

Boston Scientific Cor

  BSX   StockTA   Yahoo   News

Citizens Financial Gr

  CFG   StockTA   Yahoo   News

Cigna Corp

  CI   StockTA   Yahoo   News

Campbell Soup Company

  CPB   StockTA   Yahoo   News

Deere & Company

  DE   StockTA   Yahoo   News

DISCOVERY COMMUNICATI

  DISCA   StockTA   Yahoo   News

Discovery Inc Series

  DISCK   StockTA   Yahoo   News

Dow Inc

  DOW   StockTA   Yahoo   News

Fox Corp Class B

  FOX   StockTA   Yahoo   News

Huntington Ingalls In

  HII   StockTA   Yahoo   News

Kellogg Company

  K   StockTA   Yahoo   News

Coca-Cola Co

  KO   StockTA   Yahoo   News

Metlife Inc

  MET   StockTA   Yahoo   News

Mosaic Co

  MOS   StockTA   Yahoo   News

M&T Bank Corporation

  MTB   StockTA   Yahoo   News

Northrop Grumman Corp

  NOC   StockTA   Yahoo   News

Pinnacle West Capital

  PNW   StockTA   Yahoo   News

Charles Schwab Corpor

  SCHW   StockTA   Yahoo   News

J M Smucker Co

  SJM   StockTA   Yahoo   News

AT&T Inc.

  T   StockTA   Yahoo   News

Molson Coors Beverage

  TAP   StockTA   Yahoo   News

Truist Financial Corp

  TFC   StockTA   Yahoo   News

Viatris Inc

  VTRS   StockTA   Yahoo   News

Wells Fargo & Co

  WFC   StockTA   Yahoo   News
2 Bullish Crossing(s) today
-26 Bearish Crossing(s) today

Bullish comma separated list (upfile.txt)

Bearish comma separated list (downfile.txt)


VIX Indicator

VIX Value (03/05/2021) = 24.66

4 year historical Low

4 year historical High
10.8582.69


What is the VIX?


Distribution Charts

The current value is: 11

the median value: 61the median value: 61
4.0 Years364 Past Calendar Days

Trending Charts (Winning / Losing Streak)

The trend has changed to up today

4.0 Years364 Past Calendar Days

Copyright © 2007-2022 xsProfits All Rights Reserved | Privacy Policy__._,_.___


<*> To unsubscribe from this group, send an email to:
    brian@coxintl.com


xsProfits Website ThinkOrSwim
10/20 day MA daily table 10/20 MA Breakout Bullish Percent Index


__,_._,___

Friday, January 28, 2022

Daily xs Indicator Report (beta)

00% are trading Bullish (Above 10/20 SMA)
last successfully ran 01/28/2022 at 06:06 PM
Upward direction stocks

Description

 Symbol StockTA Yahoo News
 
No Upward directional stocks found today
 
 
Downward direction stocks

Description

 Symbol StockTA  Yahoo News

Schlumberger NV

  SLB   StockTA   Yahoo   News
0 Bullish Crossing(s) today
-1 Bearish Crossing(s) today

Bullish comma separated list (upfile.txt)

Bearish comma separated list (downfile.txt)


VIX Indicator

VIX Value (03/05/2021) = 24.66

4 year historical Low

4 year historical High
10.8582.69


What is the VIX?


Distribution Charts

The current value is: 00

the median value: 61the median value: 61
4.0 Years364 Past Calendar Days

Trending Charts (Winning / Losing Streak)

The chart has been trending down for 15 days

4.0 Years364 Past Calendar Days

Copyright © 2007-2022 xsProfits All Rights Reserved | Privacy Policy__._,_.___


<*> To unsubscribe from this group, send an email to:
    brian@coxintl.com


xsProfits Website ThinkOrSwim
10/20 day MA daily table 10/20 MA Breakout Bullish Percent Index


__,_._,___

Thursday, January 27, 2022

Daily xs Indicator Report (beta)

21% are trading Bullish (Above 10/20 SMA)
last successfully ran 01/27/2022 at 06:06 PM
Upward direction stocks

Description

 Symbol StockTA Yahoo News

Packaging Corp Of Ame

 PKG  StockTA   Yahoo   News
 
Downward direction stocks

Description

 Symbol StockTA  Yahoo News

American Internationa

  AIG   StockTA   Yahoo   News

Boeing Co

  BA   StockTA   Yahoo   News

Bank of New York Mell

  BK   StockTA   Yahoo   News

Carnival Corp

  CCL   StockTA   Yahoo   News

Church & Dwight Co.,

  CHD   StockTA   Yahoo   News

Clorox Co

  CLX   StockTA   Yahoo   News

Capital One Financial

  COF   StockTA   Yahoo   News

DISH Network Corp

  DISH   StockTA   Yahoo   News

Freeport-McMoRan Inc

  FCX   StockTA   Yahoo   News

Fifth Third Bancorp

  FITB   StockTA   Yahoo   News

General Dynamics Corp

  GD   StockTA   Yahoo   News

General Electric Comp

  GE   StockTA   Yahoo   News

Global Payments Inc

  GPN   StockTA   Yahoo   News

Huntington Bancshares

  HBAN   StockTA   Yahoo   News

Hartford Financial Se

  HIG   StockTA   Yahoo   News

Hewlett Packard Enter

  HPE   StockTA   Yahoo   News

Howmet Aerospace Inc

  HWM   StockTA   Yahoo   News

Southwest Airlines Co

  LUV   StockTA   Yahoo   News

Lamb Weston Holdings

  LW   StockTA   Yahoo   News

Organon & Co

  OGN   StockTA   Yahoo   News

Principal Financial G

  PFG   StockTA   Yahoo   News

Parker-Hannifin Corp

  PH   StockTA   Yahoo   News

PNC Financial Service

  PNC   StockTA   Yahoo   News

Regions Financial Cor

  RF   StockTA   Yahoo   News

US Bancorp

  USB   StockTA   Yahoo   News

Verizon Communication

  VZ   StockTA   Yahoo   News

Westrock Co

  WRK   StockTA   Yahoo   News

Zions Bancorporation

  ZION   StockTA   Yahoo   News
1 Bullish Crossing(s) today
-28 Bearish Crossing(s) today

Bullish comma separated list (upfile.txt)

Bearish comma separated list (downfile.txt)


VIX Indicator

VIX Value (03/05/2021) = 24.66

4 year historical Low

4 year historical High
10.8582.69


What is the VIX?


Distribution Charts

The current value is: 21

the median value: 61the median value: 61
4.0 Years364 Past Calendar Days

Trending Charts (Winning / Losing Streak)

The chart has been trending down for 14 days

4.0 Years364 Past Calendar Days

Copyright © 2007-2022 xsProfits All Rights Reserved | Privacy Policy__._,_.___


<*> To unsubscribe from this group, send an email to:
    brian@coxintl.com


xsProfits Website ThinkOrSwim
10/20 day MA daily table 10/20 MA Breakout Bullish Percent Index


__,_._,___

Wednesday, January 26, 2022

Daily xs Indicator Report (beta)

26% are trading Bullish (Above 10/20 SMA)
last successfully ran 01/26/2022 at 06:08 PM
Upward direction stocks

Description

 Symbol StockTA Yahoo News
 
No Upward directional stocks found today
 
 
Downward direction stocks

Description

 Symbol StockTA  Yahoo News

AbbVie Inc

  ABBV   StockTA   Yahoo   News

AmerisourceBergen Cor

  ABC   StockTA   Yahoo   News

Alaska Air Group, Inc

  ALK   StockTA   Yahoo   News

Ameriprise Financial,

  AMP   StockTA   Yahoo   News

Bank of America Corp

  BAC   StockTA   Yahoo   News

BorgWarner Inc.

  BWA   StockTA   Yahoo   News

Boston Properties, In

  BXP   StockTA   Yahoo   News

Comcast Corporation

  CMCSA   StockTA   Yahoo   News

Dominion Energy Inc

  D   StockTA   Yahoo   News

Discover Financial Se

  DFS   StockTA   Yahoo   News

Emerson Electric Co.

  EMR   StockTA   Yahoo   News

Ford Motor Company

  F   StockTA   Yahoo   News

Fidelity National Inf

  FIS   StockTA   Yahoo   News

FleetCor Technologies

  FLT   StockTA   Yahoo   News

Honeywell Internation

  HON   StockTA   Yahoo   News

Hormel Foods Corp

  HRL   StockTA   Yahoo   News

Illumina, Inc.

  ILMN   StockTA   Yahoo   News

Intel Corporation

  INTC   StockTA   Yahoo   News

Lincoln National Corp

  LNC   StockTA   Yahoo   News

Northern Trust Corpor

  NTRS   StockTA   Yahoo   News

ONEOK, Inc.

  OKE   StockTA   Yahoo   News

PepsiCo, Inc.

  PEP   StockTA   Yahoo   News

State Street Corp

  STT   StockTA   Yahoo   News

Vornado Realty Trust

  VNO   StockTA   Yahoo   News

Ventas, Inc.

  VTR   StockTA   Yahoo   News

Walgreens Boots Allia

  WBA   StockTA   Yahoo   News

Welltower Inc

  WELL   StockTA   Yahoo   News
0 Bullish Crossing(s) today
-27 Bearish Crossing(s) today

Bullish comma separated list (upfile.txt)

Bearish comma separated list (downfile.txt)


VIX Indicator

VIX Value (03/05/2021) = 24.66

4 year historical Low

4 year historical High
10.8582.69


What is the VIX?


Distribution Charts

The current value is: 26

the median value: 61the median value: 61
4.0 Years364 Past Calendar Days

Trending Charts (Winning / Losing Streak)

The chart has been trending down for 13 days

4.0 Years364 Past Calendar Days

Copyright © 2007-2022 xsProfits All Rights Reserved | Privacy Policy__._,_.___


<*> To unsubscribe from this group, send an email to:
    brian@coxintl.com


xsProfits Website ThinkOrSwim
10/20 day MA daily table 10/20 MA Breakout Bullish Percent Index


__,_._,___

Tuesday, January 25, 2022

Daily xs Indicator Report (beta)

31% are trading Bullish (Above 10/20 SMA)
last successfully ran 01/25/2022 at 06:05 PM
Upward direction stocks

Description

 Symbol StockTA Yahoo News
 
No Upward directional stocks found today
 
 
Downward direction stocks

Description

 Symbol StockTA  Yahoo News

Franklin Resources, I

  BEN   StockTA   Yahoo   News

Chubb Ltd

  CB   StockTA   Yahoo   News

Corteva Inc

  CTVA   StockTA   Yahoo   News

DuPont de Nemours Inc

  DD   StockTA   Yahoo   News

Fiserv Inc

  FISV   StockTA   Yahoo   News

Host Hotels and Resor

  HST   StockTA   Yahoo   News

Invesco Ltd.

  IVZ   StockTA   Yahoo   News

Kimberly Clark Corp

  KMB   StockTA   Yahoo   News

NortonLifeLock Inc

  NLOK   StockTA   Yahoo   News

Raymond James Financi

  RJF   StockTA   Yahoo   News

Synchrony Financial

  SYF   StockTA   Yahoo   News

Western Union Co

  WU   StockTA   Yahoo   News

Xcel Energy Inc

  XEL   StockTA   Yahoo   News
0 Bullish Crossing(s) today
-13 Bearish Crossing(s) today

Bullish comma separated list (upfile.txt)

Bearish comma separated list (downfile.txt)


VIX Indicator

VIX Value (03/05/2021) = 24.66

4 year historical Low

4 year historical High
10.8582.69


What is the VIX?


Distribution Charts

The current value is: 31

the median value: 61the median value: 62
4.0 Years364 Past Calendar Days

Trending Charts (Winning / Losing Streak)

The chart has been trending down for 12 days

4.0 Years364 Past Calendar Days

Copyright © 2007-2022 xsProfits All Rights Reserved | Privacy Policy__._,_.___


<*> To unsubscribe from this group, send an email to:
    brian@coxintl.com


xsProfits Website ThinkOrSwim
10/20 day MA daily table 10/20 MA Breakout Bullish Percent Index


__,_._,___

Monday, January 24, 2022

Daily xs Indicator Report (beta)

34% are trading Bullish (Above 10/20 SMA)
last successfully ran 01/24/2022 at 06:05 PM
Upward direction stocks

Description

 Symbol StockTA Yahoo News

Sealed Air Corp

 SEE  StockTA   Yahoo   News
 
Downward direction stocks

Description

 Symbol StockTA  Yahoo News

Atmos Energy Corporat

  ATO   StockTA   Yahoo   News

American Express Comp

  AXP   StockTA   Yahoo   News

Booking Holdings Inc

  BKNG   StockTA   Yahoo   News

Cardinal Health Inc

  CAH   StockTA   Yahoo   News

Celanese Corporation

  CE   StockTA   Yahoo   News

CH Robinson Worldwide

  CHRW   StockTA   Yahoo   News

Delta Air Lines, Inc.

  DAL   StockTA   Yahoo   News

DTE Energy Co

  DTE   StockTA   Yahoo   News

Kimco Realty Corp

  KIM   StockTA   Yahoo   News

Mastercard Inc

  MA   StockTA   Yahoo   News

McCormick & Company,

  MKC   StockTA   Yahoo   News

3M Co

  MMM   StockTA   Yahoo   News

Morgan Stanley

  MS   StockTA   Yahoo   News

Norwegian Cruise Line

  NCLH   StockTA   Yahoo   News

Public Service Enterp

  PEG   StockTA   Yahoo   News

Packaging Corp Of Ame

  PKG   StockTA   Yahoo   News

PPL Corp

  PPL   StockTA   Yahoo   News

Southern Co

  SO   StockTA   Yahoo   News

SYSCO Corporation

  SYY   StockTA   Yahoo   News

TransDigm Group Incor

  TDG   StockTA   Yahoo   News

United Airlines Holdi

  UAL   StockTA   Yahoo   News

WEC Energy Group Inc

  WEC   StockTA   Yahoo   News

Walmart Inc

  WMT   StockTA   Yahoo   News
1 Bullish Crossing(s) today
-23 Bearish Crossing(s) today

Bullish comma separated list (upfile.txt)

Bearish comma separated list (downfile.txt)


VIX Indicator

VIX Value (03/05/2021) = 24.66

4 year historical Low

4 year historical High
10.8582.69


What is the VIX?


Distribution Charts

The current value is: 34

the median value: 61the median value: 62
4.0 Years364 Past Calendar Days

Trending Charts (Winning / Losing Streak)

The chart has been trending down for 11 days

4.0 Years364 Past Calendar Days

Copyright © 2007-2022 xsProfits All Rights Reserved | Privacy Policy__._,_.___


<*> To unsubscribe from this group, send an email to:
    brian@coxintl.com


xsProfits Website ThinkOrSwim
10/20 day MA daily table 10/20 MA Breakout Bullish Percent Index


__,_._,___