Tuesday, March 31, 2020

Daily xs Indicator Report (beta)

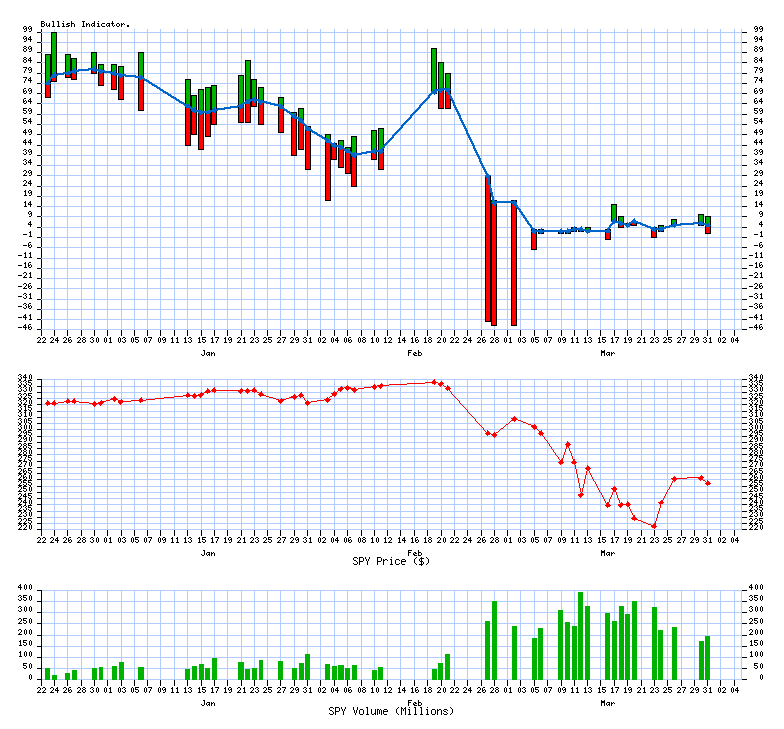
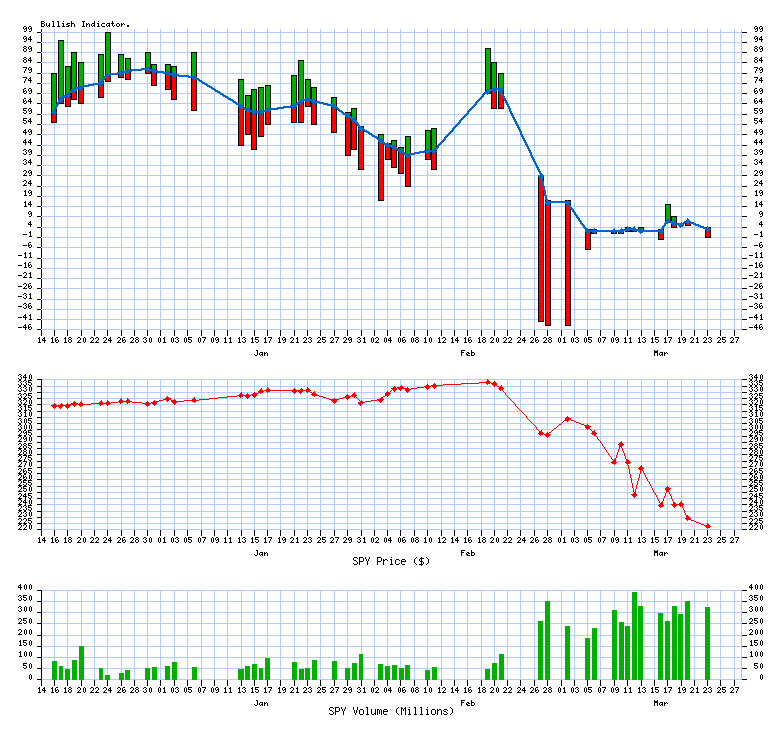
05% are trading Bullish (Above 10/20 SMA)
last successfully ran 03/31/2020 at 06:12 PM
Upward direction stocks

Description

 Symbol StockTA Yahoo News

Cisco Systems, Inc.

 CSCO  StockTA   Yahoo   News

FedEx Corporation

 FDX  StockTA   Yahoo   News

Frontier Communicatio

 FTR  StockTA   Yahoo   News

Illumina, Inc.

 ILMN  StockTA   Yahoo   News
 
Downward direction stocks

Description

 Symbol StockTA  Yahoo News

ConAgra Foods Inc

  CAG   StockTA   Yahoo   News

Diamond Offshore Dril

  DO   StockTA   Yahoo   News

EQT Corporation

  EQT   StockTA   Yahoo   News

Wal-Mart Stores, Inc.

  WMT   StockTA   Yahoo   News
4 Bullish Crossing(s) today
-4 Bearish Crossing(s) today

Bullish comma separated list (upfile.txt)

Bearish comma separated list (downfile.txt)


VIX Indicator

VIX Value (03/31/2020) = 53.54

4 year historical Low

4 year historical High
10.8582.69


What is the VIX?


Distribution Charts

The current value is: 05

the median value: 59the median value: 60
4.0 Years364 Past Calendar Days

Trending Charts (Winning / Losing Streak)

The trend has changed to down today

4.0 Years364 Past Calendar Days

Copyright © 2007-2020 xsProfits All Rights Reserved | Privacy Policy__._,_.___


<*> To unsubscribe from this group, send an email to:
    brian@coxintl.com


xsProfits Website ThinkOrSwim
10/20 day MA daily table 10/20 MA Breakout Bullish Percent Index


__,_._,___

Monday, March 30, 2020

Daily xs Indicator Report (beta)

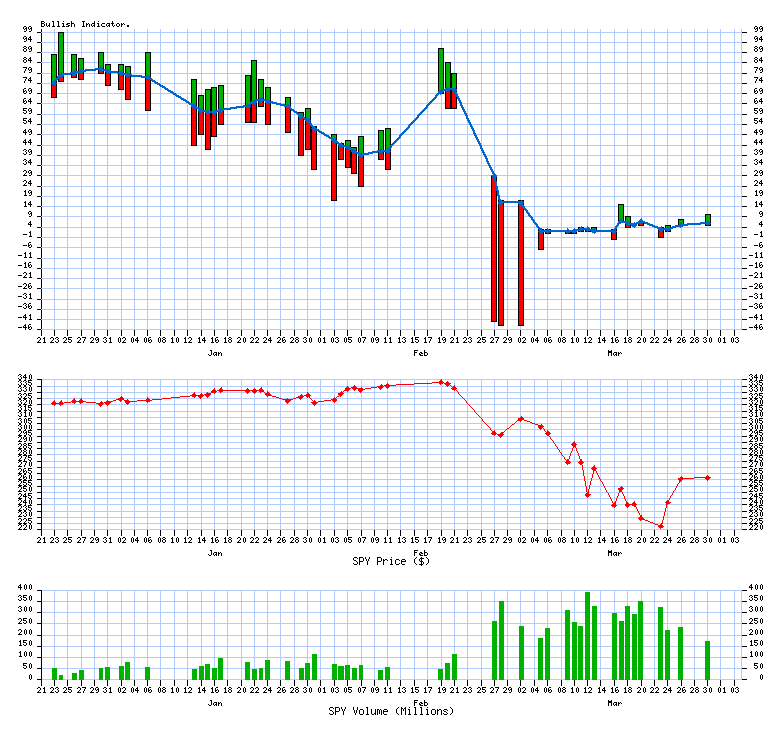
06% are trading Bullish (Above 10/20 SMA)
last successfully ran 03/30/2020 at 06:08 PM
Upward direction stocks

Description

 Symbol StockTA Yahoo News

Amazon.com, Inc.

 AMZN  StockTA   Yahoo   News

ConAgra Foods Inc

 CAG  StockTA   Yahoo   News

Oracle Corporation

 ORCL  StockTA   Yahoo   News

Wal-Mart Stores, Inc.

 WMT  StockTA   Yahoo   News
 
Downward direction stocks

Description

 Symbol StockTA  Yahoo News

The Kroger Co

  KR   StockTA   Yahoo   News
4 Bullish Crossing(s) today
-1 Bearish Crossing(s) today

Bullish comma separated list (upfile.txt)

Bearish comma separated list (downfile.txt)


VIX Indicator

VIX Value (03/30/2020) = 57.08

4 year historical Low

4 year historical High
10.8582.69


What is the VIX?


Distribution Charts

The current value is: 06

the median value: 59the median value: 60
4.0 Years364 Past Calendar Days

Trending Charts (Winning / Losing Streak)

The chart has been trending up for 2 days

4.0 Years364 Past Calendar Days

Copyright © 2007-2020 xsProfits All Rights Reserved | Privacy Policy__._,_.___


<*> To unsubscribe from this group, send an email to:
    brian@coxintl.com


xsProfits Website ThinkOrSwim
10/20 day MA daily table 10/20 MA Breakout Bullish Percent Index


__,_._,___

Thursday, March 26, 2020

Daily xs Indicator Report (beta)

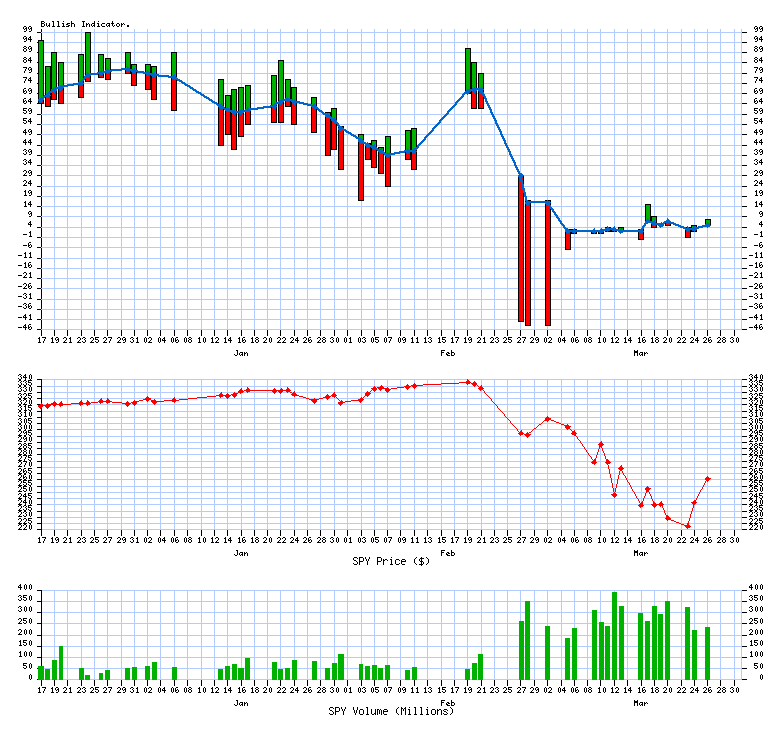
05% are trading Bullish (Above 10/20 SMA)
last successfully ran 03/26/2020 at 06:52 PM
Upward direction stocks

Description

 Symbol StockTA Yahoo News

Akamai Technologies,

 AKAM  StockTA   Yahoo   News

Gilead Sciences, Inc.

 GILD  StockTA   Yahoo   News

Wal-Mart Stores, Inc.

 WMT  StockTA   Yahoo   News
 
Downward direction stocks

Description

 Symbol StockTA  Yahoo News
 
No Downward directional stocks found today
 
3 Bullish Crossing(s) today
0 Bearish Crossing(s) today

Bullish comma separated list (upfile.txt)

Bearish comma separated list (downfile.txt)


VIX Indicator

VIX Value (03/26/2020) = 61.00

4 year historical Low

4 year historical High
10.8582.69


What is the VIX?


Distribution Charts

The current value is: 05

the median value: 59the median value: 61
4.0 Years364 Past Calendar Days

Trending Charts (Winning / Losing Streak)

The trend has changed to up today

4.0 Years364 Past Calendar Days

Copyright © 2007-2020 xsProfits All Rights Reserved | Privacy Policy__._,_.___


<*> To unsubscribe from this group, send an email to:
    brian@coxintl.com


xsProfits Website ThinkOrSwim
10/20 day MA daily table 10/20 MA Breakout Bullish Percent Index


__,_._,___

Tuesday, March 24, 2020

Daily xs Indicator Report (beta)

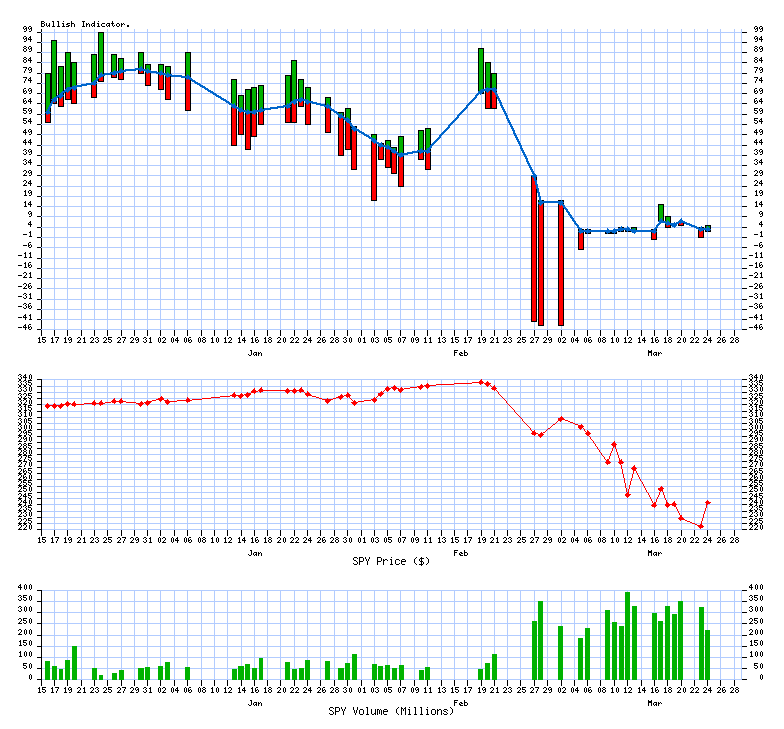
03% are trading Bullish (Above 10/20 SMA)
last successfully ran 03/24/2020 at 06:09 PM
Upward direction stocks

Description

 Symbol StockTA Yahoo News

Diamond Offshore Dril

 DO  StockTA   Yahoo   News

Range Resources Corp.

 RRC  StockTA   Yahoo   News
 
Downward direction stocks

Description

 Symbol StockTA  Yahoo News

Wal-Mart Stores, Inc.

  WMT   StockTA   Yahoo   News
2 Bullish Crossing(s) today
-1 Bearish Crossing(s) today

Bullish comma separated list (upfile.txt)

Bearish comma separated list (downfile.txt)


VIX Indicator

VIX Value (03/24/2020) = 61.67

4 year historical Low

4 year historical High
10.8582.69


What is the VIX?


Distribution Charts

The current value is: 03

the median value: 59the median value: 61
4.0 Years364 Past Calendar Days

Trending Charts (Winning / Losing Streak)

The chart has been trending down for 2 days

4.0 Years364 Past Calendar Days

Copyright © 2007-2020 xsProfits All Rights Reserved | Privacy Policy__._,_.___


<*> To unsubscribe from this group, send an email to:
    brian@coxintl.com


xsProfits Website ThinkOrSwim
10/20 day MA daily table 10/20 MA Breakout Bullish Percent Index


__,_._,___

Monday, March 23, 2020

Daily xs Indicator Report (beta)

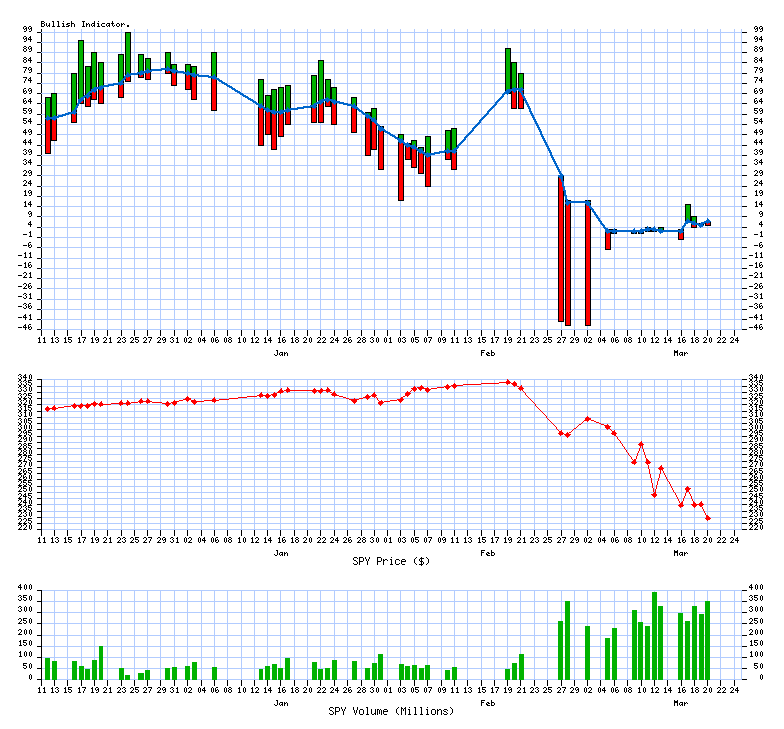
03% are trading Bullish (Above 10/20 SMA)
last successfully ran 03/23/2020 at 06:29 PM
Upward direction stocks

Description

 Symbol StockTA Yahoo News

United Parcel Service

 UPS  StockTA   Yahoo   News
 
Downward direction stocks

Description

 Symbol StockTA  Yahoo News

Campbell Soup Company

  CPB   StockTA   Yahoo   News

Regeneron Pharmaceuti

  REGN   StockTA   Yahoo   News

J M Smucker Co

  SJM   StockTA   Yahoo   News

Tegna Inc

  TGNA   StockTA   Yahoo   News
1 Bullish Crossing(s) today
-4 Bearish Crossing(s) today

Bullish comma separated list (upfile.txt)

Bearish comma separated list (downfile.txt)


VIX Indicator

VIX Value (03/23/2020) = 61.59

4 year historical Low

4 year historical High
10.8582.69


What is the VIX?


Distribution Charts

The current value is: 03

the median value: 59the median value: 61
4.0 Years364 Past Calendar Days

Trending Charts (Winning / Losing Streak)

The trend has changed to down today

4.0 Years364 Past Calendar Days

Copyright © 2007-2020 xsProfits All Rights Reserved | Privacy Policy__._,_.___


<*> To unsubscribe from this group, send an email to:
    brian@coxintl.com


xsProfits Website ThinkOrSwim
10/20 day MA daily table 10/20 MA Breakout Bullish Percent Index


__,_._,___

Friday, March 20, 2020

Daily xs Indicator Report (beta)

07% are trading Bullish (Above 10/20 SMA)
last successfully ran 03/20/2020 at 06:19 PM
Upward direction stocks

Description

 Symbol StockTA Yahoo News
 
No Upward directional stocks found today
 
 
Downward direction stocks

Description

 Symbol StockTA  Yahoo News

Consolidated Edison,

  ED   StockTA   Yahoo   News

Gilead Sciences, Inc.

  GILD   StockTA   Yahoo   News
0 Bullish Crossing(s) today
-2 Bearish Crossing(s) today

Bullish comma separated list (upfile.txt)

Bearish comma separated list (downfile.txt)


VIX Indicator

VIX Value (03/20/2020) = 66.04

4 year historical Low

4 year historical High
10.8582.69


What is the VIX?


Distribution Charts

The current value is: 07

the median value: 59the median value: 61
4.0 Years364 Past Calendar Days

Trending Charts (Winning / Losing Streak)

The trend has changed to up today

4.0 Years364 Past Calendar Days

Copyright © 2007-2020 xsProfits All Rights Reserved | Privacy Policy__._,_.___


<*> To unsubscribe from this group, send an email to:
    brian@coxintl.com


xsProfits Website ThinkOrSwim
10/20 day MA daily table 10/20 MA Breakout Bullish Percent Index


__,_._,___

Thursday, March 19, 2020

Daily xs Indicator Report (beta)

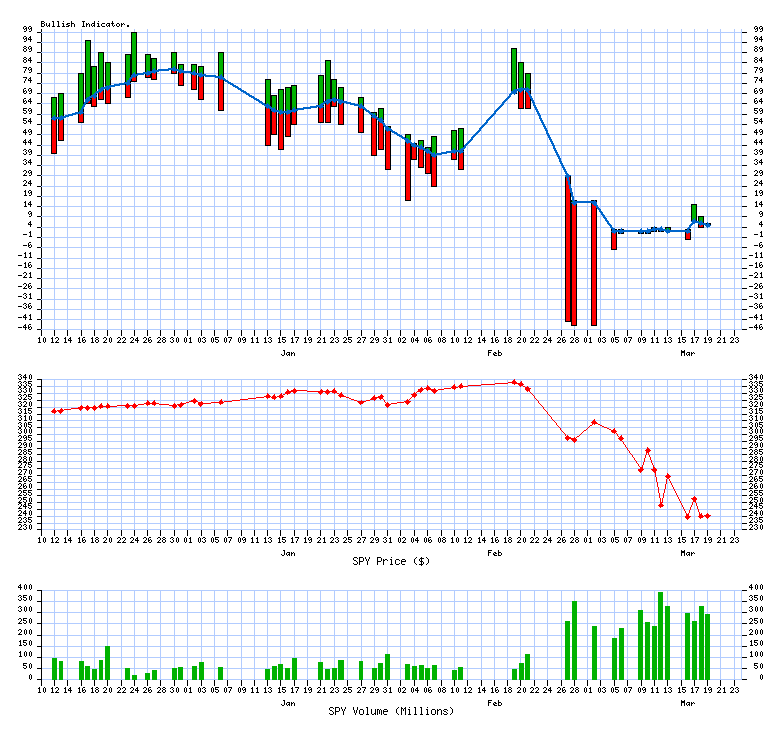
05% are trading Bullish (Above 10/20 SMA)
last successfully ran 03/19/2020 at 06:23 PM
Upward direction stocks

Description

 Symbol StockTA Yahoo News

Hormel Foods Corp

 HRL  StockTA   Yahoo   News
 
Downward direction stocks

Description

 Symbol StockTA  Yahoo News
 
No Downward directional stocks found today
 
1 Bullish Crossing(s) today
0 Bearish Crossing(s) today

Bullish comma separated list (upfile.txt)

Bearish comma separated list (downfile.txt)


VIX Indicator

VIX Value (03/19/2020) = 72.00

4 year historical Low

4 year historical High
10.8582.69


What is the VIX?


Distribution Charts

The current value is: 05

the median value: 59the median value: 61
4.0 Years364 Past Calendar Days

Trending Charts (Winning / Losing Streak)

The chart has been trending down for 2 days

4.0 Years364 Past Calendar Days

Copyright © 2007-2020 xsProfits All Rights Reserved | Privacy Policy__._,_.___


<*> To unsubscribe from this group, send an email to:
    brian@coxintl.com


xsProfits Website ThinkOrSwim
10/20 day MA daily table 10/20 MA Breakout Bullish Percent Index


__,_._,___

Wednesday, March 18, 2020

Daily xs Indicator Report (beta)

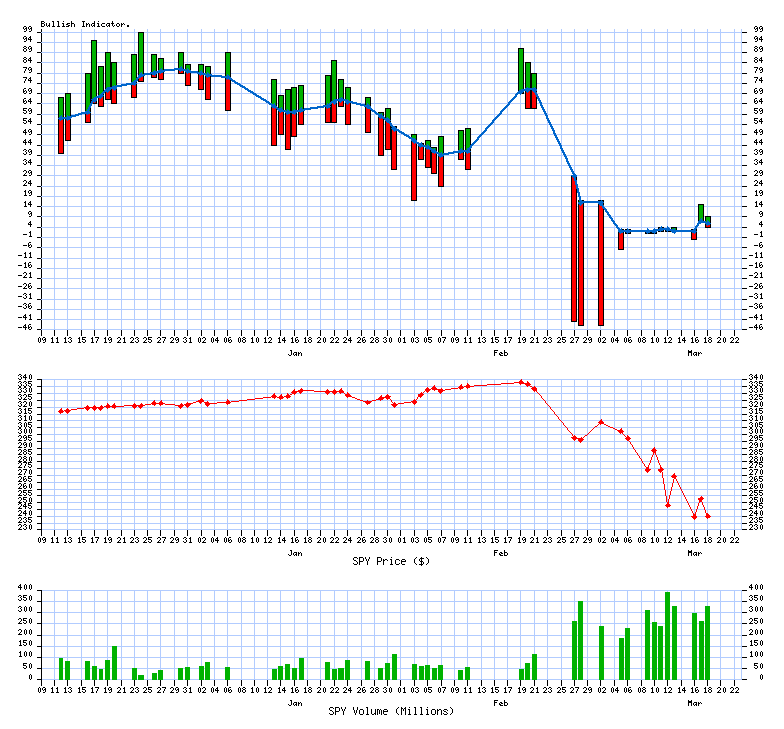
06% are trading Bullish (Above 10/20 SMA)
last successfully ran 03/18/2020 at 06:31 PM
Upward direction stocks

Description

 Symbol StockTA Yahoo News

Consolidated Edison,

 ED  StockTA   Yahoo   News

Hormel Foods Corp

 HRL  StockTA   Yahoo   News

Kellogg Company

 K  StockTA   Yahoo   News
 
Downward direction stocks

Description

 Symbol StockTA  Yahoo News

Centene Corp

  CNC   StockTA   Yahoo   News

Kimberly Clark Corp

  KMB   StockTA   Yahoo   News
3 Bullish Crossing(s) today
-2 Bearish Crossing(s) today

Bullish comma separated list (upfile.txt)

Bearish comma separated list (downfile.txt)


VIX Indicator

VIX Value (03/18/2020) = 76.45

4 year historical Low

4 year historical High
10.8582.69


What is the VIX?


Distribution Charts

The current value is: 06

the median value: 59the median value: 61
4.0 Years364 Past Calendar Days

Trending Charts (Winning / Losing Streak)

The trend has changed to down today

4.0 Years364 Past Calendar Days

Copyright © 2007-2020 xsProfits All Rights Reserved | Privacy Policy__._,_.___


<*> To unsubscribe from this group, send an email to:
    brian@coxintl.com


xsProfits Website ThinkOrSwim
10/20 day MA daily table 10/20 MA Breakout Bullish Percent Index


__,_._,___