Thursday, January 31, 2019

Daily xs Indicator Report (beta)

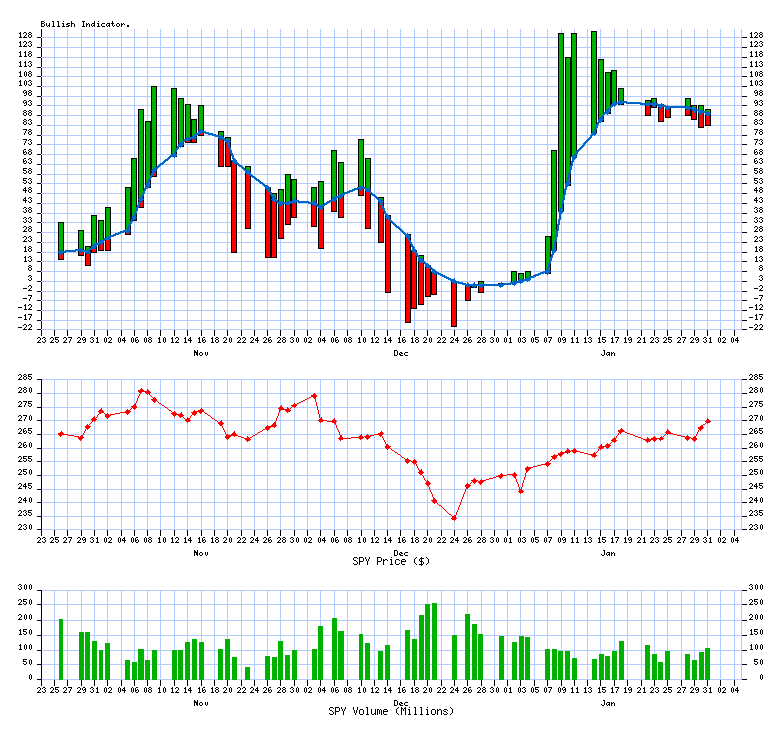
89% are trading Bullish (Above 10/20 SMA)
last successfully ran 01/31/2019 at 06:12 PM
Upward direction stocks

Description

 Symbol StockTA Yahoo News

Delta Air Lines, Inc.

 DAL  StockTA   Yahoo   News

Gap Inc

 GPS  StockTA   Yahoo   News
 
Downward direction stocks

Description

 Symbol StockTA  Yahoo News

Amgen, Inc.

  AMGN   StockTA   Yahoo   News

Citrix Systems, Inc.

  CTXS   StockTA   Yahoo   News

Diamond Offshore Dril

  DO   StockTA   Yahoo   News

H & R Block Inc

  HRB   StockTA   Yahoo   News

Hormel Foods Corp

  HRL   StockTA   Yahoo   News

Range Resources Corp.

  RRC   StockTA   Yahoo   News
2 Bullish Crossing(s) today
-6 Bearish Crossing(s) today

Bullish comma separated list (upfile.txt)

Bearish comma separated list (downfile.txt)


VIX Indicator

VIX Value (01/30/2019) = 17.66

4 year historical Low

4 year historical High
9.1437.32


What is the VIX?


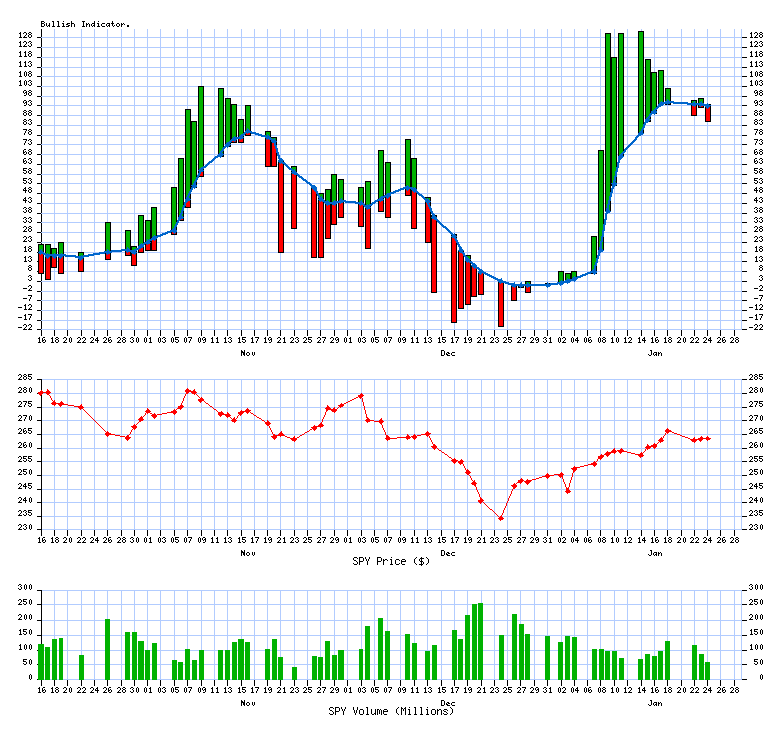
Distribution Charts

The current value is: 89

the median value: 56the median value: 56
4.0 Years364 Past Calendar Days

Trending Charts (Winning / Losing Streak)

The chart has been trending down for 8 days

4.0 Years364 Past Calendar Days

Copyright © 2007-2019 xsProfits All Rights Reserved | Privacy Policy__._,_.___


<*> To unsubscribe from this group, send an email to:
    brian@coxintl.com


xsProfits Website Investools Think Or Swim
10/20 day MA daily table 10/20 MA Breakout Bullish Percent Index


__,_._,___

Wednesday, January 30, 2019

Daily xs Indicator Report (beta)

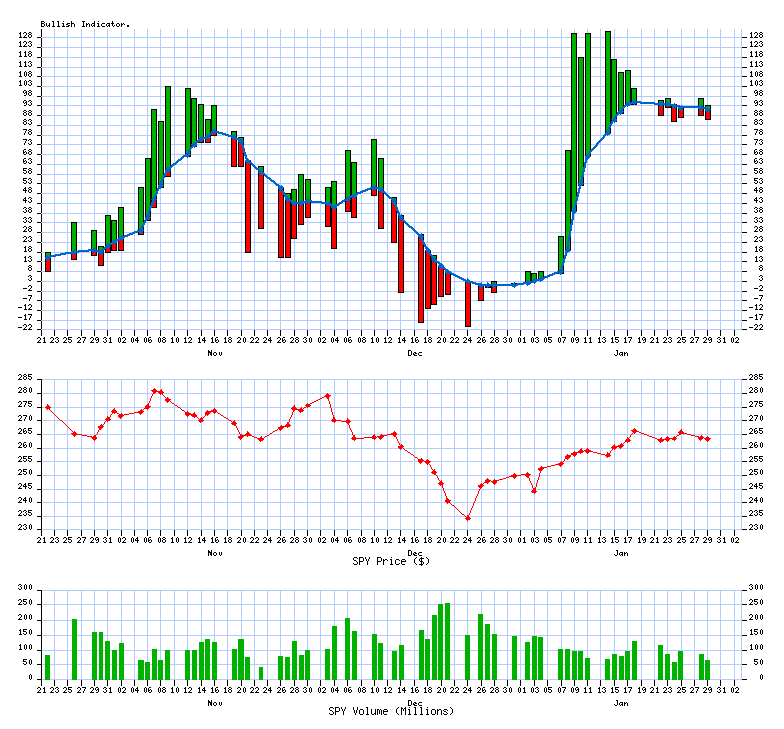
90% are trading Bullish (Above 10/20 SMA)
last successfully ran 01/30/2019 at 06:12 PM
Upward direction stocks

Description

 Symbol StockTA Yahoo News

Air Products & Chemic

 APD  StockTA   Yahoo   News

Estee Lauder Companie

 EL  StockTA   Yahoo   News

Sherwin-Williams Co

 SHW  StockTA   Yahoo   News
 
Downward direction stocks

Description

 Symbol StockTA  Yahoo News

Acuity Brands, Inc.

  AYI   StockTA   Yahoo   News

D.R. Horton, Inc.

  DHI   StockTA   Yahoo   News

Walt Disney Co

  DIS   StockTA   Yahoo   News

Dollar Tree, Inc.

  DLTR   StockTA   Yahoo   News

EQT Corporation

  EQT   StockTA   Yahoo   News

Illumina, Inc.

  ILMN   StockTA   Yahoo   News

Pioneer Natural Resou

  PXD   StockTA   Yahoo   News

Vulcan Materials Comp

  VMC   StockTA   Yahoo   News
3 Bullish Crossing(s) today
-8 Bearish Crossing(s) today

Bullish comma separated list (upfile.txt)

Bearish comma separated list (downfile.txt)


VIX Indicator

VIX Value (01/29/2019) = 19.13

4 year historical Low

4 year historical High
9.1437.32


What is the VIX?


Distribution Charts

The current value is: 90

the median value: 56the median value: 56
4.0 Years364 Past Calendar Days

Trending Charts (Winning / Losing Streak)

The chart has been trending down for 7 days

4.0 Years364 Past Calendar Days

Copyright © 2007-2019 xsProfits All Rights Reserved | Privacy Policy__._,_.___


<*> To unsubscribe from this group, send an email to:
    brian@coxintl.com


xsProfits Website Investools Think Or Swim
10/20 day MA daily table 10/20 MA Breakout Bullish Percent Index


__,_._,___

Tuesday, January 29, 2019

Daily xs Indicator Report (beta)

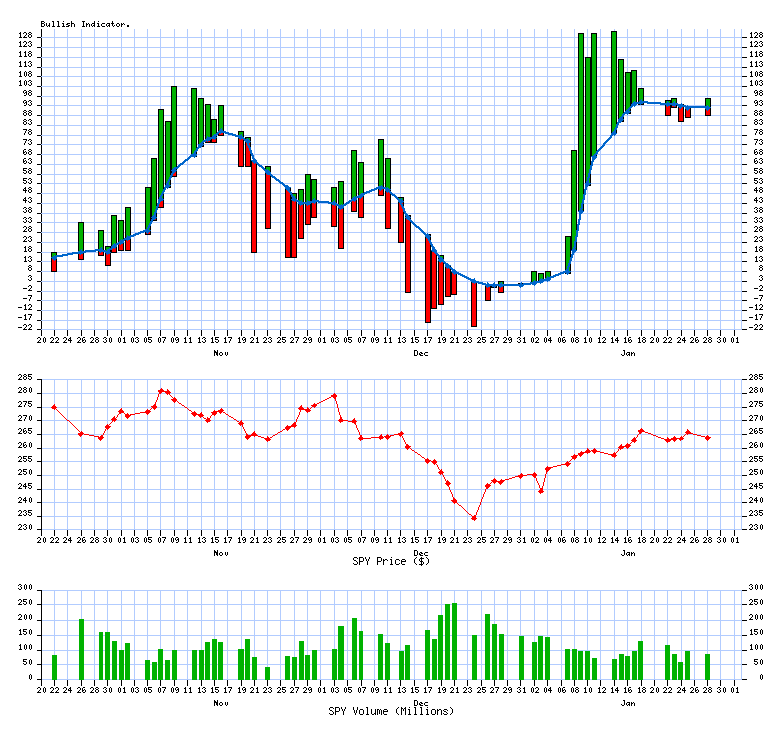
91% are trading Bullish (Above 10/20 SMA)
last successfully ran 01/29/2019 at 06:06 PM
Upward direction stocks

Description

 Symbol StockTA Yahoo News

AutoZone, Inc.

 AZO  StockTA   Yahoo   News

PepsiCo, Inc.

 PEP  StockTA   Yahoo   News
 
Downward direction stocks

Description

 Symbol StockTA  Yahoo News

Advance Auto Parts, I

  AAP   StockTA   Yahoo   News

Coca-Cola European Pa

  CCEP   StockTA   Yahoo   News

Church & Dwight Co.,

  CHD   StockTA   Yahoo   News

Stanley Black & Decke

  SWK   StockTA   Yahoo   News

Verizon Communication

  VZ   StockTA   Yahoo   News
2 Bullish Crossing(s) today
-5 Bearish Crossing(s) today

Bullish comma separated list (upfile.txt)

Bearish comma separated list (downfile.txt)


VIX Indicator

VIX Value (01/28/2019) = 18.87

4 year historical Low

4 year historical High
9.1437.32


What is the VIX?


Distribution Charts

The current value is: 91

the median value: 56the median value: 56
4.0 Years364 Past Calendar Days

Trending Charts (Winning / Losing Streak)

The chart has been trending down for 6 days

4.0 Years364 Past Calendar Days

Copyright © 2007-2019 xsProfits All Rights Reserved | Privacy Policy__._,_.___


<*> To unsubscribe from this group, send an email to:
    brian@coxintl.com


xsProfits Website Investools Think Or Swim
10/20 day MA daily table 10/20 MA Breakout Bullish Percent Index


__,_._,___

Monday, January 28, 2019

Daily xs Indicator Report (beta)

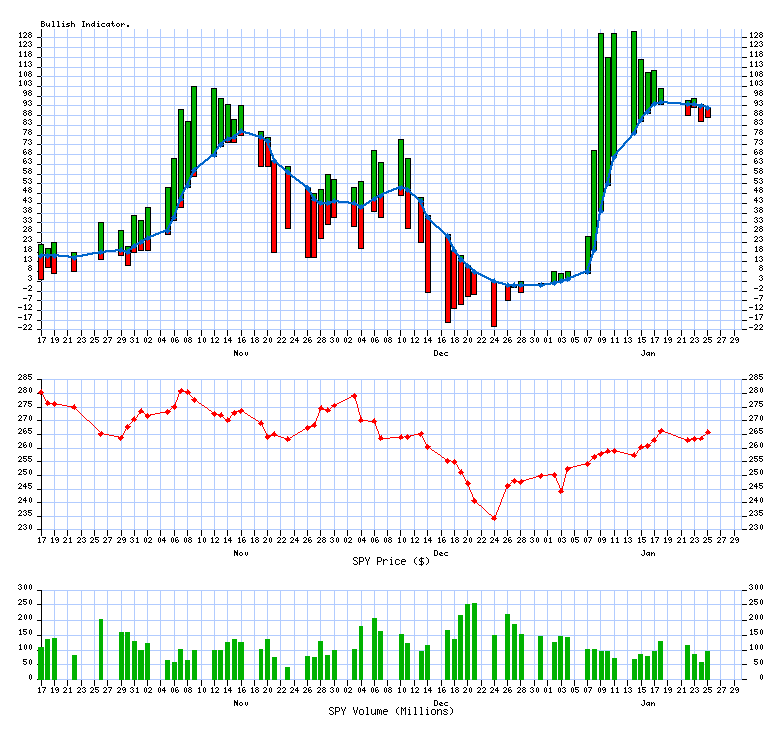
92% are trading Bullish (Above 10/20 SMA)
last successfully ran 01/28/2019 at 06:06 PM
Upward direction stocks

Description

 Symbol StockTA Yahoo News

CME Group Inc

 CME  StockTA   Yahoo   News

Duke Energy Corp

 DUK  StockTA   Yahoo   News

L Brands Inc

 LB  StockTA   Yahoo   News

Medtronic PLC

 MDT  StockTA   Yahoo   News

Constellation Brands,

 STZ  StockTA   Yahoo   News
 
Downward direction stocks

Description

 Symbol StockTA  Yahoo News

Kimberly Clark Corp

  KMB   StockTA   Yahoo   News

Lowe's Companies, Inc

  LOW   StockTA   Yahoo   News

Motorola Solutions In

  MSI   StockTA   Yahoo   News

PulteGroup, Inc.

  PHM   StockTA   Yahoo   News
5 Bullish Crossing(s) today
-4 Bearish Crossing(s) today

Bullish comma separated list (upfile.txt)

Bearish comma separated list (downfile.txt)


VIX Indicator

VIX Value (01/25/2019) = 17.42

4 year historical Low

4 year historical High
9.1437.32


What is the VIX?


Distribution Charts

The current value is: 92

the median value: 56the median value: 56
4.0 Years364 Past Calendar Days

Trending Charts (Winning / Losing Streak)

The chart has been trending down for 5 days

4.0 Years364 Past Calendar Days

Copyright © 2007-2019 xsProfits All Rights Reserved | Privacy Policy__._,_.___


<*> To unsubscribe from this group, send an email to:
    brian@coxintl.com


xsProfits Website Investools Think Or Swim
10/20 day MA daily table 10/20 MA Breakout Bullish Percent Index


__,_._,___

Friday, January 25, 2019

Daily xs Indicator Report (beta)

92% are trading Bullish (Above 10/20 SMA)
last successfully ran 01/25/2019 at 06:06 PM
Upward direction stocks

Description

 Symbol StockTA Yahoo News
 
No Upward directional stocks found today
 
 
Downward direction stocks

Description

 Symbol StockTA  Yahoo News

Centurylink Inc

  CTL   StockTA   Yahoo   News

Frontier Communicatio

  FTR   StockTA   Yahoo   News

L Brands Inc

  LB   StockTA   Yahoo   News

McCormick & Company,

  MKC   StockTA   Yahoo   News

Sherwin-Williams Co

  SHW   StockTA   Yahoo   News
0 Bullish Crossing(s) today
-5 Bearish Crossing(s) today

Bullish comma separated list (upfile.txt)

Bearish comma separated list (downfile.txt)


VIX Indicator

VIX Value (01/24/2019) = 18.89

4 year historical Low

4 year historical High
9.1437.32


What is the VIX?


Distribution Charts

The current value is: 92

the median value: 56the median value: 56
4.0 Years364 Past Calendar Days

Trending Charts (Winning / Losing Streak)

The chart has been trending down for 4 days

4.0 Years364 Past Calendar Days

Copyright © 2007-2019 xsProfits All Rights Reserved | Privacy Policy__._,_.___


<*> To unsubscribe from this group, send an email to:
    brian@coxintl.com


xsProfits Website Investools Think Or Swim
10/20 day MA daily table 10/20 MA Breakout Bullish Percent Index


__,_._,___

Thursday, January 24, 2019

Daily xs Indicator Report (beta)

93% are trading Bullish (Above 10/20 SMA)
last successfully ran 01/24/2019 at 06:06 PM
Upward direction stocks

Description

 Symbol StockTA Yahoo News

Bristol-Myers Squibb

 BMY  StockTA   Yahoo   News
 
Downward direction stocks

Description

 Symbol StockTA  Yahoo News

Activision Blizzard,

  ATVI   StockTA   Yahoo   News

CF Industries Holding

  CF   StockTA   Yahoo   News

Clorox Co

  CLX   StockTA   Yahoo   News

F5 Networks, Inc.

  FFIV   StockTA   Yahoo   News

Goodyear Tire & Rubbe

  GT   StockTA   Yahoo   News

Nordstrom, Inc.

  JWN   StockTA   Yahoo   News

CarMax, Inc

  KMX   StockTA   Yahoo   News

Merck & Co., Inc.

  MRK   StockTA   Yahoo   News
1 Bullish Crossing(s) today
-8 Bearish Crossing(s) today

Bullish comma separated list (upfile.txt)

Bearish comma separated list (downfile.txt)


VIX Indicator

VIX Value (01/23/2019) = 19.52

4 year historical Low

4 year historical High
9.1437.32


What is the VIX?


Distribution Charts

The current value is: 93

the median value: 56the median value: 56
4.0 Years364 Past Calendar Days

Trending Charts (Winning / Losing Streak)

The chart has been trending down for 3 days

4.0 Years364 Past Calendar Days

Copyright © 2007-2019 xsProfits All Rights Reserved | Privacy Policy__._,_.___


<*> To unsubscribe from this group, send an email to:
    brian@coxintl.com


xsProfits Website Investools Think Or Swim
10/20 day MA daily table 10/20 MA Breakout Bullish Percent Index


__,_._,___

Wednesday, January 23, 2019

Daily xs Indicator Report (beta)

94% are trading Bullish (Above 10/20 SMA)
last successfully ran 01/23/2019 at 06:13 PM
Upward direction stocks

Description

 Symbol StockTA Yahoo News

Consolidated Edison,

 ED  StockTA   Yahoo   News

Intercontinental Exch

 ICE  StockTA   Yahoo   News

Pinnacle West Capital

 PNW  StockTA   Yahoo   News
 
Downward direction stocks

Description

 Symbol StockTA  Yahoo News

Edison International

  EIX   StockTA   Yahoo   News

Pfizer Inc.

  PFE   StockTA   Yahoo   News
3 Bullish Crossing(s) today
-2 Bearish Crossing(s) today

Bullish comma separated list (upfile.txt)

Bearish comma separated list (downfile.txt)


VIX Indicator

VIX Value (01/22/2019) = 20.80

4 year historical Low

4 year historical High
9.1437.32


What is the VIX?


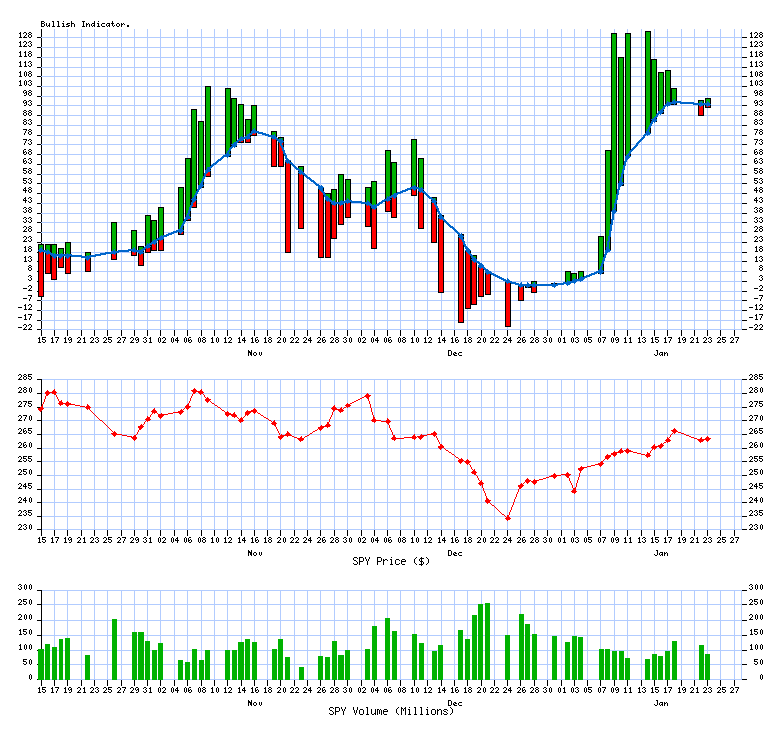
Distribution Charts

The current value is: 94

the median value: 56the median value: 56
4.0 Years364 Past Calendar Days

Trending Charts (Winning / Losing Streak)

The chart has been trending down for 2 days

4.0 Years364 Past Calendar Days

Copyright © 2007-2019 xsProfits All Rights Reserved | Privacy Policy__._,_.___


<*> To unsubscribe from this group, send an email to:
    brian@coxintl.com


xsProfits Website Investools Think Or Swim
10/20 day MA daily table 10/20 MA Breakout Bullish Percent Index


__,_._,___

Tuesday, January 22, 2019

Daily xs Indicator Report (beta)

94% are trading Bullish (Above 10/20 SMA)
last successfully ran 01/22/2019 at 06:16 PM
Upward direction stocks

Description

 Symbol StockTA Yahoo News

Apple Inc.

 AAPL  StockTA   Yahoo   News

Crown Castle Internat

 CCI  StockTA   Yahoo   News
 
Downward direction stocks

Description

 Symbol StockTA  Yahoo News

AbbVie Inc

  ABBV   StockTA   Yahoo   News

Air Products & Chemic

  APD   StockTA   Yahoo   News

CVS Health Corp

  CVS   StockTA   Yahoo   News

Gap Inc

  GPS   StockTA   Yahoo   News

QUALCOMM, Inc.

  QCOM   StockTA   Yahoo   News

Signet Jewelers Ltd.

  SIG   StockTA   Yahoo   News
2 Bullish Crossing(s) today
-6 Bearish Crossing(s) today

Bullish comma separated list (upfile.txt)

Bearish comma separated list (downfile.txt)


VIX Indicator

VIX Value (01/18/2019) = 17.80

4 year historical Low

4 year historical High
9.1437.32


What is the VIX?


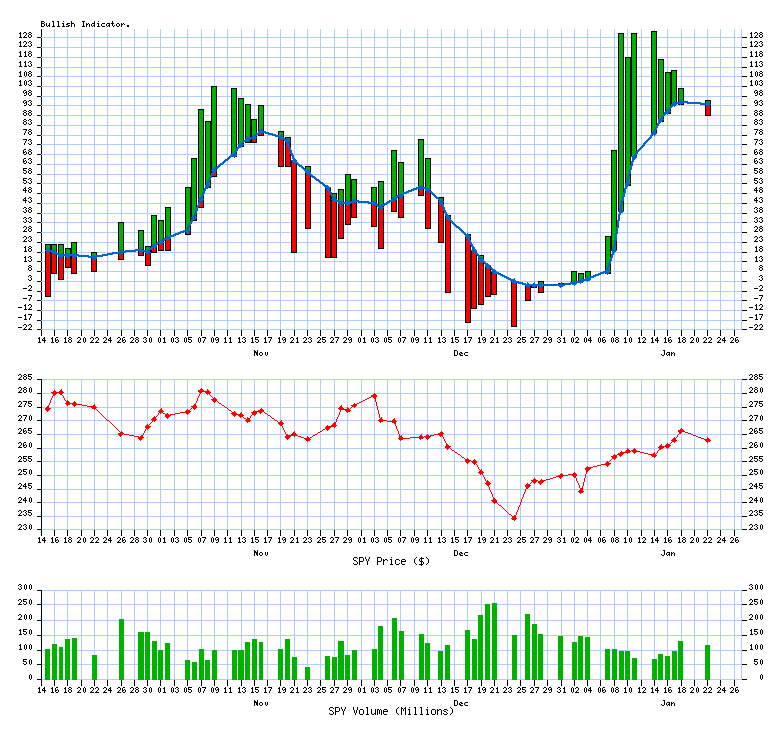
Distribution Charts

The current value is: 94

the median value: 56the median value: 56
4.0 Years364 Past Calendar Days

Trending Charts (Winning / Losing Streak)

The trend has changed to down today

4.0 Years364 Past Calendar Days

Copyright © 2007-2019 xsProfits All Rights Reserved | Privacy Policy__._,_.___


<*> To unsubscribe from this group, send an email to:
    brian@coxintl.com


xsProfits Website Investools Think Or Swim
10/20 day MA daily table 10/20 MA Breakout Bullish Percent Index


__,_._,___