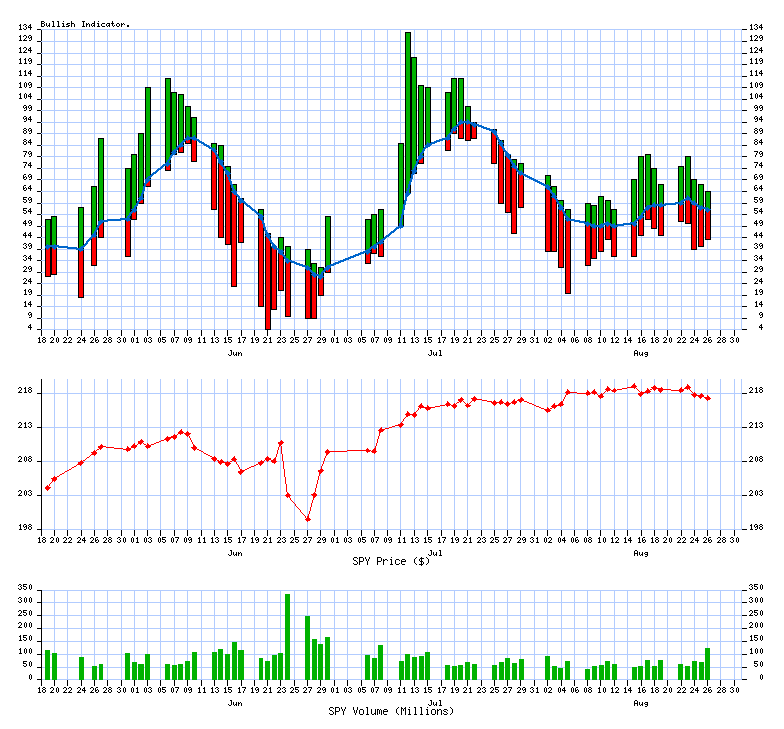
Wednesday, August 31, 2016

Daily xs Indicator Report (beta)

53% are trading Bullish (Above 10/20 SMA)
last successfully ran 08/31/2016 at 06:04 PM
Upward direction stocks

Description

 Symbol StockTA Yahoo News

Aon plc Class A Ordin

 AON  StockTA   Yahoo   News

Activision Blizzard,

 ATVI  StockTA   Yahoo   News

eBay Inc

 EBAY  StockTA   Yahoo   News

Hartford Financial Se

 HIG  StockTA   Yahoo   News

The Kroger Co

 KR  StockTA   Yahoo   News

Perrigo Company plc O

 PRGO  StockTA   Yahoo   News

Tripadvisor Inc

 TRIP  StockTA   Yahoo   News

Total System Services

 TSS  StockTA   Yahoo   News
 
Downward direction stocks

Description

 Symbol StockTA  Yahoo News

Apple Inc.

  AAPL   StockTA   Yahoo   News

Aetna Inc

  AET   StockTA   Yahoo   News

Ball Corporation

  BLL   StockTA   Yahoo   News

Caterpillar Inc.

  CAT   StockTA   Yahoo   News

Delta Air Lines, Inc.

  DAL   StockTA   Yahoo   News

Emerson Electric Co.

  EMR   StockTA   Yahoo   News

Fidelity National Inf

  FIS   StockTA   Yahoo   News

Harman International

  HAR   StockTA   Yahoo   News

Hewlett Packard Enter

  HPE   StockTA   Yahoo   News

H & R Block Inc

  HRB   StockTA   Yahoo   News

Hershey Co

  HSY   StockTA   Yahoo   News

Humana Inc

  HUM   StockTA   Yahoo   News

CarMax, Inc

  KMX   StockTA   Yahoo   News

The Coca-Cola Co

  KO   StockTA   Yahoo   News

Microsoft Corporation

  MSFT   StockTA   Yahoo   News

Pentair plc. Ordinary

  PNR   StockTA   Yahoo   News

Rockwell Automation

  ROK   StockTA   Yahoo   News

Schlumberger Limited.

  SLB   StockTA   Yahoo   News

Texas Instruments Inc

  TXN   StockTA   Yahoo   News

Ulta Salon, Cosmetics

  ULTA   StockTA   Yahoo   News
8 Bullish Crossing(s) today
-20 Bearish Crossing(s) today

Bullish comma separated list (upfile.txt)

Bearish comma separated list (downfile.txt)


VIX Indicator

VIX Value (08/31/2016) = 13.42

4 year historical Low

4 year historical High
10.2853.29


What is the VIX?


Distribution Charts

The current value is: 53

the median value: 57the median value: 56
4.0 Years364 Past Calendar Days

Trending Charts (Winning / Losing Streak)

The chart has been trending down for 6 days

4.0 Years364 Past Calendar Days

Copyright © 2007-2016 xsProfits All Rights Reserved | Privacy Policy__._,_.___


<*> To unsubscribe from this group, send an email to:
    brian@coxintl.com


xsProfits Website Investools Think Or Swim
10/20 day MA daily table 10/20 MA Breakout Bullish Percent Index


__,_._,___

Tuesday, August 30, 2016

Daily xs Indicator Report (beta)

55% are trading Bullish (Above 10/20 SMA)
last successfully ran 08/30/2016 at 06:05 PM
Upward direction stocks

Description

 Symbol StockTA Yahoo News

Becton Dickinson and

 BDX  StockTA   Yahoo   News

Boston Scientific Cor

 BSX  StockTA   Yahoo   News

ConAgra Foods Inc

 CAG  StockTA   Yahoo   News

CenterPoint Energy, I

 CNP  StockTA   Yahoo   News

Facebook Inc

 FB  StockTA   Yahoo   News

Mondelez Internationa

 MDLZ  StockTA   Yahoo   News

Monsanto Company

 MON  StockTA   Yahoo   News

Nasdaq Inc

 NDAQ  StockTA   Yahoo   News

T. Rowe Price Group I

 TROW  StockTA   Yahoo   News

Varian Medical System

 VAR  StockTA   Yahoo   News

XL Group plc

 XL  StockTA   Yahoo   News
 
Downward direction stocks

Description

 Symbol StockTA  Yahoo News

Anthem Inc

  ANTM   StockTA   Yahoo   News

D.R. Horton, Inc.

  DHI   StockTA   Yahoo   News

Discovery Communicati

  DISCA   StockTA   Yahoo   News

Darden Restaurants, I

  DRI   StockTA   Yahoo   News

Corning Incorporated

  GLW   StockTA   Yahoo   News

Harley-Davidson Inc

  HOG   StockTA   Yahoo   News

Intuit Inc.

  INTU   StockTA   Yahoo   News

Paypal Holdings Inc

  PYPL   StockTA   Yahoo   News

Spectra Energy Corp.

  SE   StockTA   Yahoo   News

Signet Jewelers Ltd.

  SIG   StockTA   Yahoo   News

Tegna Inc

  TGNA   StockTA   Yahoo   News

Walgreens Boots Allia

  WBA   StockTA   Yahoo   News

Zoetis Inc

  ZTS   StockTA   Yahoo   News
11 Bullish Crossing(s) today
-13 Bearish Crossing(s) today

Bullish comma separated list (upfile.txt)

Bearish comma separated list (downfile.txt)


VIX Indicator

VIX Value (08/30/2016) = 13.12

4 year historical Low

4 year historical High
10.2853.29


What is the VIX?


Distribution Charts

The current value is: 55

the median value: 57the median value: 56
4.0 Years364 Past Calendar Days

Trending Charts (Winning / Losing Streak)

The chart has been trending down for 5 days

4.0 Years364 Past Calendar Days

Copyright © 2007-2016 xsProfits All Rights Reserved | Privacy Policy__._,_.___


<*> To unsubscribe from this group, send an email to:
    brian@coxintl.com


xsProfits Website Investools Think Or Swim
10/20 day MA daily table 10/20 MA Breakout Bullish Percent Index


__,_._,___

Monday, August 29, 2016

Daily xs Indicator Report (beta)

56% are trading Bullish (Above 10/20 SMA)
last successfully ran 08/29/2016 at 06:05 PM
Upward direction stocks

Description

 Symbol StockTA Yahoo News

Dominion Resources, I

 D  StockTA   Yahoo   News

Delta Air Lines, Inc.

 DAL  StockTA   Yahoo   News

Dow Chemical Co

 DOW  StockTA   Yahoo   News

E*TRADE Financial Cor

 ETFC  StockTA   Yahoo   News

Iron Mountain Inc

 IRM  StockTA   Yahoo   News

Michael Kors Holdings

 KORS  StockTA   Yahoo   News

Metlife Inc

 MET  StockTA   Yahoo   News
 
Downward direction stocks

Description

 Symbol StockTA  Yahoo News

Agilent Technologies

  A   StockTA   Yahoo   News

Analog Devices, Inc.

  ADI   StockTA   Yahoo   News

Amgen, Inc.

  AMGN   StockTA   Yahoo   News

Dun & Bradstreet Corp

  DNB   StockTA   Yahoo   News

J B Hunt Transport Se

  JBHT   StockTA   Yahoo   News

Mattel, Inc.

  MAT   StockTA   Yahoo   News

Mallinckrodt PLC

  MNK   StockTA   Yahoo   News

Newfield Exploration

  NFX   StockTA   Yahoo   News

Newell Brands Inc

  NWL   StockTA   Yahoo   News
7 Bullish Crossing(s) today
-9 Bearish Crossing(s) today

Bullish comma separated list (upfile.txt)

Bearish comma separated list (downfile.txt)


VIX Indicator

VIX Value (08/29/2016) = 12.94

4 year historical Low

4 year historical High
10.2853.29


What is the VIX?


Distribution Charts

The current value is: 56

the median value: 57the median value: 56
4.0 Years364 Past Calendar Days

Trending Charts (Winning / Losing Streak)

The chart has been trending down for 4 days

4.0 Years364 Past Calendar Days

Copyright © 2007-2016 xsProfits All Rights Reserved | Privacy Policy__._,_.___


<*> To unsubscribe from this group, send an email to:
    brian@coxintl.com


xsProfits Website Investools Think Or Swim
10/20 day MA daily table 10/20 MA Breakout Bullish Percent Index


__,_._,___

Friday, August 26, 2016

Daily xs Indicator Report (beta)

56% are trading Bullish (Above 10/20 SMA)
last successfully ran 08/26/2016 at 08:16 PM
Upward direction stocks

Description

 Symbol StockTA Yahoo News

Chipotle Mexican Gril

 CMG  StockTA   Yahoo   News

Fluor Corporation (NE

 FLR  StockTA   Yahoo   News

Nielsen N.V. Ordinary

 NLSN  StockTA   Yahoo   News

Qorvo Inc

 QRVO  StockTA   Yahoo   News

Starbucks Corporation

 SBUX  StockTA   Yahoo   News

S&P Global Inc

 SPGI  StockTA   Yahoo   News

Molson Coors Brewing

 TAP  StockTA   Yahoo   News

Verisk Analytics, Inc

 VRSK  StockTA   Yahoo   News
 
Downward direction stocks

Description

 Symbol StockTA  Yahoo News

AmerisourceBergen Cor

  ABC   StockTA   Yahoo   News

Allstate Corp

  ALL   StockTA   Yahoo   News

Biogen Inc

  BIIB   StockTA   Yahoo   News

CBRE Group Inc

  CBG   StockTA   Yahoo   News

Costco Wholesale Corp

  COST   StockTA   Yahoo   News

CVS Health Corp

  CVS   StockTA   Yahoo   News

Walt Disney Co

  DIS   StockTA   Yahoo   News

Express Scripts Holdi

  ESRX   StockTA   Yahoo   News

Expedia Inc

  EXPE   StockTA   Yahoo   News

Ingersoll-Rand PLC

  IR   StockTA   Yahoo   News

Leggett & Platt, Inc.

  LEG   StockTA   Yahoo   News

Mohawk Industries, In

  MHK   StockTA   Yahoo   News

Republic Services, In

  RSG   StockTA   Yahoo   News
8 Bullish Crossing(s) today
-13 Bearish Crossing(s) today

Bullish comma separated list (upfile.txt)

Bearish comma separated list (downfile.txt)


VIX Indicator

VIX Value (08/26/2016) = 13.65

4 year historical Low

4 year historical High
10.2853.29


What is the VIX?


Distribution Charts

The current value is: 56

the median value: 57the median value: 56
4.0 Years364 Past Calendar Days

Trending Charts (Winning / Losing Streak)

The chart has been trending down for 3 days

4.0 Years364 Past Calendar Days

Copyright © 2007-2016 xsProfits All Rights Reserved | Privacy Policy__._,_.___


<*> To unsubscribe from this group, send an email to:
    brian@coxintl.com


xsProfits Website Investools Think Or Swim
10/20 day MA daily table 10/20 MA Breakout Bullish Percent Index


__,_._,___

Thursday, August 25, 2016

Daily xs Indicator Report (beta)

57% are trading Bullish (Above 10/20 SMA)
last successfully ran 08/25/2016 at 06:04 PM
Upward direction stocks

Description

 Symbol StockTA Yahoo News

D.R. Horton, Inc.

 DHI  StockTA   Yahoo   News

Delphi Automotive PLC

 DLPH  StockTA   Yahoo   News

EQT Corporation

 EQT  StockTA   Yahoo   News

Leggett & Platt, Inc.

 LEG  StockTA   Yahoo   News

Lam Research Corporat

 LRCX  StockTA   Yahoo   News

Pitney Bowes Inc.

 PBI  StockTA   Yahoo   News

Range Resources Corp.

 RRC  StockTA   Yahoo   News

Southwestern Energy C

 SWN  StockTA   Yahoo   News

Tegna Inc

 TGNA  StockTA   Yahoo   News

Western Digital Corp

 WDC  StockTA   Yahoo   News
 
Downward direction stocks

Description

 Symbol StockTA  Yahoo News

AbbVie Inc

  ABBV   StockTA   Yahoo   News

Alexion Pharmaceutica

  ALXN   StockTA   Yahoo   News

Amazon.com, Inc.

  AMZN   StockTA   Yahoo   News

Boston Properties, In

  BXP   StockTA   Yahoo   News

Cerner Corporation

  CERN   StockTA   Yahoo   News

Church & Dwight Co.,

  CHD   StockTA   Yahoo   News

Colgate-Palmolive Com

  CL   StockTA   Yahoo   News

Alphabet Inc

  GOOG   StockTA   Yahoo   News

Alphabet Inc

  GOOGL   StockTA   Yahoo   News

Hasbro, Inc.

  HAS   StockTA   Yahoo   News

International Busines

  IBM   StockTA   Yahoo   News

Medtronic PLC

  MDT   StockTA   Yahoo   News

PG&E Corporation

  PCG   StockTA   Yahoo   News

SL Green Realty Corp

  SLG   StockTA   Yahoo   News

Tesoro Corporation

  TSO   StockTA   Yahoo   News

Vertex Pharmaceutical

  VRTX   StockTA   Yahoo   News

Wal-Mart Stores, Inc.

  WMT   StockTA   Yahoo   News
10 Bullish Crossing(s) today
-17 Bearish Crossing(s) today

Bullish comma separated list (upfile.txt)

Bearish comma separated list (downfile.txt)


VIX Indicator

VIX Value (08/25/2016) = 13.63

4 year historical Low

4 year historical High
10.2853.29


What is the VIX?


Distribution Charts

The current value is: 57

the median value: 57the median value: 56
4.0 Years364 Past Calendar Days

Trending Charts (Winning / Losing Streak)

The chart has been trending down for 2 days

4.0 Years364 Past Calendar Days

Copyright © 2007-2016 xsProfits All Rights Reserved | Privacy Policy__._,_.___


<*> To unsubscribe from this group, send an email to:
    brian@coxintl.com


xsProfits Website Investools Think Or Swim
10/20 day MA daily table 10/20 MA Breakout Bullish Percent Index


__,_._,___