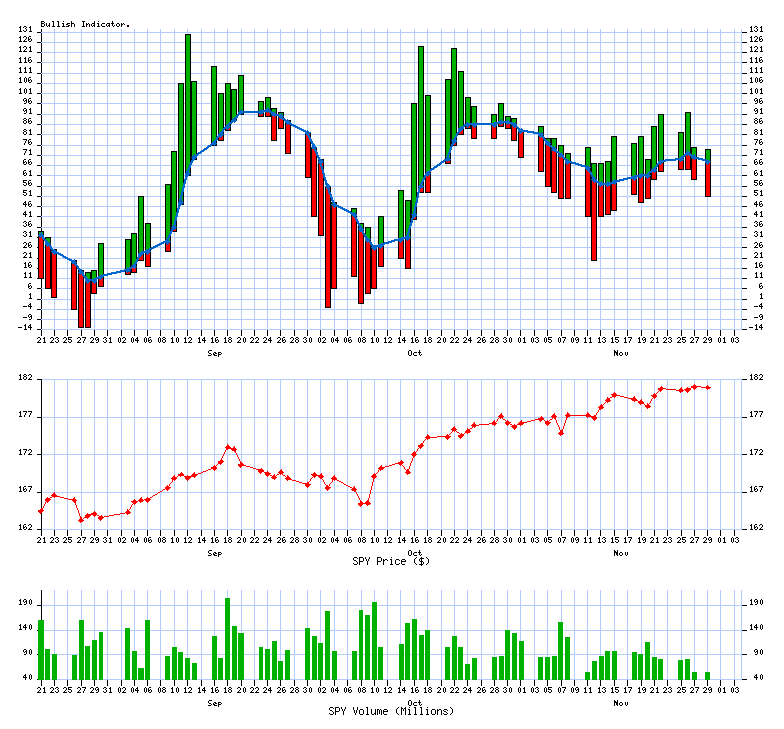
Friday, November 29, 2013

Daily xs Indicator Report (beta)

68% are trading Bullish (Above 10/20 SMA)
last successfully ran 11/29/2013 at 05:54 PM
Upward direction stocks

Description

 Symbol StockTA Yahoo News

Alcoa Inc

 AA  StockTA   Yahoo   News

Bemis inc

 BMS  StockTA   Yahoo   News

Cabot Oil & Gas Corpo

 COG  StockTA   Yahoo   News

Discovery Communicati

 DISCA  StockTA   Yahoo   News

EMC Corporation

 EMC  StockTA   Yahoo   News

Expeditors Internatio

 EXPD  StockTA   Yahoo   News
 
Downward direction stocks

Description

 Symbol StockTA  Yahoo News

Analog Devices, Inc.

  ADI   StockTA   Yahoo   News

BEAM Inc

  BEAM   StockTA   Yahoo   News

CF Industries Holding

  CF   StockTA   Yahoo   News

Chipotle Mexican Gril

  CMG   StockTA   Yahoo   News

First Solar, Inc.

  FSLR   StockTA   Yahoo   News

Starwood Hotels & Res

  HOT   StockTA   Yahoo   News

Kimberly Clark Corp

  KMB   StockTA   Yahoo   News

Legg Mason, Inc.

  LM   StockTA   Yahoo   News

Medtronic, Inc.

  MDT   StockTA   Yahoo   News

McCormick & Company,

  MKC   StockTA   Yahoo   News

Altria Group Inc

  MO   StockTA   Yahoo   News

PepsiCo, Inc.

  PEP   StockTA   Yahoo   News

The Southern Company

  SO   StockTA   Yahoo   News

Seagate Technology PL

  STX   StockTA   Yahoo   News

Target Corporation

  TGT   StockTA   Yahoo   News

Urban Outfitters, Inc

  URBN   StockTA   Yahoo   News

Vornado Realty Trust

  VNO   StockTA   Yahoo   News
6 Bullish Crossing(s) today
-17 Bearish Crossing(s) today

Bullish comma separated list (upfile.txt)

Bearish comma separated list (downfile.txt)


VIX Indicator

VIX Value (11/29/2013) = 12.98

4 year historical Low

4 year historical High
11.0548.00


What is the VIX?


Distribution Charts

The current value is: 68

the median value: 64the median value: 70
4.0 Years364 Past Calendar Days

Trending Charts (Winning / Losing Streak)

The chart has been trending down for 2 days

4.0 Years364 Past Calendar Days

Copyright © 2007-2013 xsProfits All Rights Reserved | Privacy Policy__._,_.___


<*> To unsubscribe from this group, send an email to:
    brian@coxintl.com


xsProfits Website Investools Think Or Swim
10/20 day MA daily table 10/20 MA Breakout Bullish Percent Index


__,_._,___

Wednesday, November 27, 2013

Daily xs Indicator Report (beta)

70% are trading Bullish (Above 10/20 SMA)
last successfully ran 11/27/2013 at 05:13 PM
Upward direction stocks

Description

 Symbol StockTA Yahoo News

H&R Block, Inc.

 HRB  StockTA   Yahoo   News

Vornado Realty Trust

 VNO  StockTA   Yahoo   News

Wisconsin Energy Corp

 WEC  StockTA   Yahoo   News

Williams Companies, I

 WMB  StockTA   Yahoo   News

Weyerhaeuser Company

 WY  StockTA   Yahoo   News
 
Downward direction stocks

Description

 Symbol StockTA  Yahoo News

Archer Daniels Midlan

  ADM   StockTA   Yahoo   News

Akamai Technologies,

  AKAM   StockTA   Yahoo   News

Boston Scientific Cor

  BSX   StockTA   Yahoo   News

CBS Corporation

  CBS   StockTA   Yahoo   News

CenterPoint Energy, I

  CNP   StockTA   Yahoo   News

EMC Corporation

  EMC   StockTA   Yahoo   News

Halliburton Company

  HAL   StockTA   Yahoo   News

NextEra Energy, Inc.

  NEE   StockTA   Yahoo   News

Public Service Enterp

  PEG   StockTA   Yahoo   News

Reynolds American, In

  RAI   StockTA   Yahoo   News

Walgreen Company

  WAG   StockTA   Yahoo   News
5 Bullish Crossing(s) today
-11 Bearish Crossing(s) today

Bullish comma separated list (upfile.txt)

Bearish comma separated list (downfile.txt)


VIX Indicator

VIX Value (11/27/2013) = 12.81

4 year historical Low

4 year historical High
11.0548.00


What is the VIX?


Distribution Charts

The current value is: 70

the median value: 64the median value: 70
4.0 Years364 Past Calendar Days

Trending Charts (Winning / Losing Streak)

The trend has changed to down today

4.0 Years364 Past Calendar Days

Copyright © 2007-2013 xsProfits All Rights Reserved | Privacy Policy__._,_.___


<*> To unsubscribe from this group, send an email to:
    brian@coxintl.com


xsProfits Website Investools Think Or Swim
10/20 day MA daily table 10/20 MA Breakout Bullish Percent Index


__,_._,___

Tuesday, November 26, 2013

Daily xs Indicator Report (beta)

72% are trading Bullish (Above 10/20 SMA)
last successfully ran 11/26/2013 at 05:19 PM
Upward direction stocks

Description

 Symbol StockTA Yahoo News

AbbVie Inc

 ABBV  StockTA   Yahoo   News

Archer Daniels Midlan

 ADM  StockTA   Yahoo   News

American Internationa

 AIG  StockTA   Yahoo   News

Alexion Pharmaceutica

 ALXN  StockTA   Yahoo   News

Apollo Group Inc

 APOL  StockTA   Yahoo   News

BEAM Inc

 BEAM  StockTA   Yahoo   News

BlackRock, Inc.

 BLK  StockTA   Yahoo   News

CBRE Group Inc

 CBG  StockTA   Yahoo   News

Discover Financial Se

 DFS  StockTA   Yahoo   News

Edwards Lifesciences

 EW  StockTA   Yahoo   News

Ford Motor Company

 F  StockTA   Yahoo   News

Hormel Foods Corporat

 HRL  StockTA   Yahoo   News

Lennar Corporation

 LEN  StockTA   Yahoo   News

MeadWestvaco Corp.

 MWV  StockTA   Yahoo   News

News Corp

 NWSA  StockTA   Yahoo   News

PPL Corporation

 PPL  StockTA   Yahoo   News

SCANA Corporation

 SCG  StockTA   Yahoo   News

Sherwin-Williams Comp

 SHW  StockTA   Yahoo   News

St. Jude Medical, Inc

 STJ  StockTA   Yahoo   News

Seagate Technology PL

 STX  StockTA   Yahoo   News
 
Downward direction stocks

Description

 Symbol StockTA  Yahoo News

ADT Corp

  ADT   StockTA   Yahoo   News

salesforce.com, inc.

  CRM   StockTA   Yahoo   News

Quest Diagnostics Inc

  DGX   StockTA   Yahoo   News

Dollar Tree, Inc.

  DLTR   StockTA   Yahoo   News

Hewlett-Packard Compa

  HPQ   StockTA   Yahoo   News

Jacobs Engineering Gr

  JEC   StockTA   Yahoo   News

Lowe's Companies, Inc

  LOW   StockTA   Yahoo   News

Patterson Companies,

  PDCO   StockTA   Yahoo   News
20 Bullish Crossing(s) today
-8 Bearish Crossing(s) today

Bullish comma separated list (upfile.txt)

Bearish comma separated list (downfile.txt)


VIX Indicator

VIX Value (11/26/2013) = 12.81

4 year historical Low

4 year historical High
11.0548.00


What is the VIX?


Distribution Charts

The current value is: 72

the median value: 64the median value: 70
4.0 Years364 Past Calendar Days

Trending Charts (Winning / Losing Streak)

The chart has been trending up for 8 days

4.0 Years364 Past Calendar Days

Copyright © 2007-2013 xsProfits All Rights Reserved | Privacy Policy__._,_.___


<*> To unsubscribe from this group, send an email to:
    brian@coxintl.com


xsProfits Website Investools Think Or Swim
10/20 day MA daily table 10/20 MA Breakout Bullish Percent Index


__,_._,___

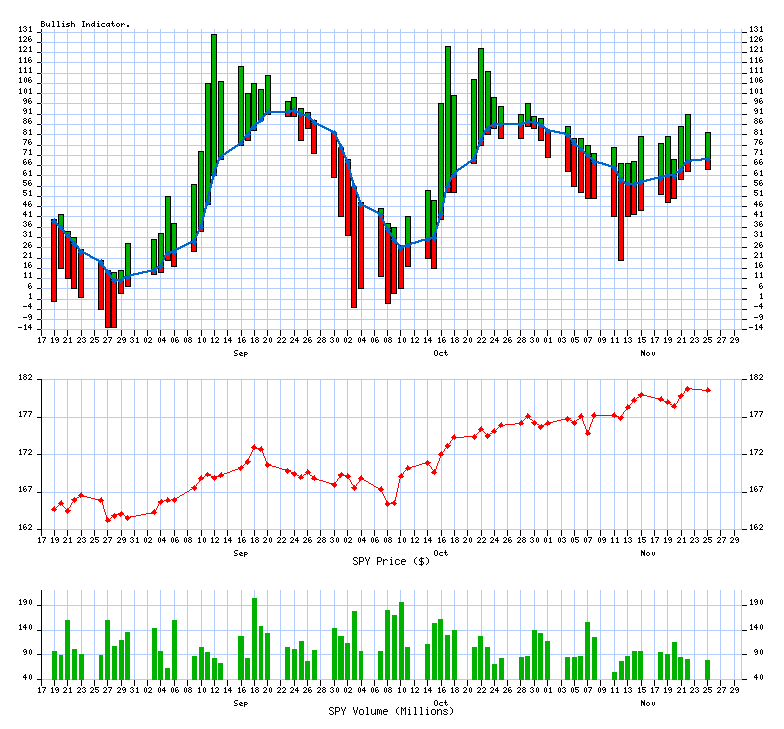
Monday, November 25, 2013

Daily xs Indicator Report (beta)

69% are trading Bullish (Above 10/20 SMA)
last successfully ran 11/25/2013 at 06:04 PM
Upward direction stocks

Description

 Symbol StockTA Yahoo News

Apple Inc.

 AAPL  StockTA   Yahoo   News

BB&T Corporation

 BBT  StockTA   Yahoo   News

BorgWarner Inc.

 BWA  StockTA   Yahoo   News

Comcast Corporation

 CMCSA  StockTA   Yahoo   News

Corning Incorporated

 GLW  StockTA   Yahoo   News

Garmin Ltd.

 GRMN  StockTA   Yahoo   News

Kinder Morgan Inc

 KMI  StockTA   Yahoo   News

Leggett & Platt, Inc.

 LEG  StockTA   Yahoo   News

Monster Beverage Corp

 MNST  StockTA   Yahoo   News

Precision Castparts C

 PCP  StockTA   Yahoo   News

Sigma-Aldrich Corpora

 SIAL  StockTA   Yahoo   News

Southwestern Energy C

 SWN  StockTA   Yahoo   News

Stryker Corporation

 SYK  StockTA   Yahoo   News
 
Downward direction stocks

Description

 Symbol StockTA  Yahoo News

Cliffs Natural Resour

  CLF   StockTA   Yahoo   News

Citrix Systems, Inc.

  CTXS   StockTA   Yahoo   News

Kansas City Southern

  KSU   StockTA   Yahoo   News

Nucor Corporation

  NUE   StockTA   Yahoo   News

Rowan Companies PLC

  RDC   StockTA   Yahoo   News
13 Bullish Crossing(s) today
-5 Bearish Crossing(s) today

Bullish comma separated list (upfile.txt)

Bearish comma separated list (downfile.txt)


VIX Indicator

VIX Value (11/25/2013) = 12.79

4 year historical Low

4 year historical High
11.0548.00


What is the VIX?


Distribution Charts

The current value is: 69

the median value: 64the median value: 70
4.0 Years364 Past Calendar Days

Trending Charts (Winning / Losing Streak)

The chart has been trending up for 7 days

4.0 Years364 Past Calendar Days

Copyright © 2007-2013 xsProfits All Rights Reserved | Privacy Policy__._,_.___


<*> To unsubscribe from this group, send an email to:
    brian@coxintl.com


xsProfits Website Investools Think Or Swim
10/20 day MA daily table 10/20 MA Breakout Bullish Percent Index


__,_._,___

Friday, November 22, 2013

Daily xs Indicator Report (beta)

68% are trading Bullish (Above 10/20 SMA)
last successfully ran 11/22/2013 at 07:28 PM
Upward direction stocks

Description

 Symbol StockTA Yahoo News

American Express Comp

 AXP  StockTA   Yahoo   News

Franklin Resources, I

 BEN  StockTA   Yahoo   News

Biogen Idec Inc.

 BIIB  StockTA   Yahoo   News

CareFusion Corporatio

 CFN  StockTA   Yahoo   News

Capital One Financial

 COF  StockTA   Yahoo   News

D.R. Horton, Inc.

 DHI  StockTA   Yahoo   News

Delphi Automotive PLC

 DLPH  StockTA   Yahoo   News

EQT Corporation

 EQT  StockTA   Yahoo   News

Gilead Sciences, Inc.

 GILD  StockTA   Yahoo   News

Hasbro, Inc.

 HAS  StockTA   Yahoo   News

Hess Corp.

 HES  StockTA   Yahoo   News

Masco Corporation

 MAS  StockTA   Yahoo   News

Mondelez Internationa

 MDLZ  StockTA   Yahoo   News

NiSource Inc.

 NI  StockTA   Yahoo   News

Norfolk Southern Corp

 NSC  StockTA   Yahoo   News

Public Service Enterp

 PEG  StockTA   Yahoo   News

PulteGroup, Inc.

 PHM  StockTA   Yahoo   News

PerkinElmer, Inc.

 PKI  StockTA   Yahoo   News

QEP Resources Inc

 QEP  StockTA   Yahoo   News

Roper Industries, Inc

 ROP  StockTA   Yahoo   News

TE Connectivity Ltd.

 TEL  StockTA   Yahoo   News

Visa Inc

 V  StockTA   Yahoo   News

Waters Corporation

 WAT  StockTA   Yahoo   News
 
Downward direction stocks

Description

 Symbol StockTA  Yahoo News

Archer Daniels Midlan

  ADM   StockTA   Yahoo   News

Bristol Myers Squibb

  BMY   StockTA   Yahoo   News

Eastman Chemical Comp

  EMN   StockTA   Yahoo   News

Nabors Industries Ltd

  NBR   StockTA   Yahoo   News

Philip Morris Interna

  PM   StockTA   Yahoo   News
23 Bullish Crossing(s) today
-5 Bearish Crossing(s) today

Bullish comma separated list (upfile.txt)

Bearish comma separated list (downfile.txt)


VIX Indicator

VIX Value (11/22/2013) = 12.26

4 year historical Low

4 year historical High
11.0548.00


What is the VIX?


Distribution Charts

The current value is: 68

the median value: 64the median value: 70
4.0 Years364 Past Calendar Days

Trending Charts (Winning / Losing Streak)

The chart has been trending up for 6 days

4.0 Years364 Past Calendar Days

Copyright © 2007-2013 xsProfits All Rights Reserved | Privacy Policy__._,_.___


<*> To unsubscribe from this group, send an email to:
    brian@coxintl.com


xsProfits Website Investools Think Or Swim
10/20 day MA daily table 10/20 MA Breakout Bullish Percent Index


__,_._,___