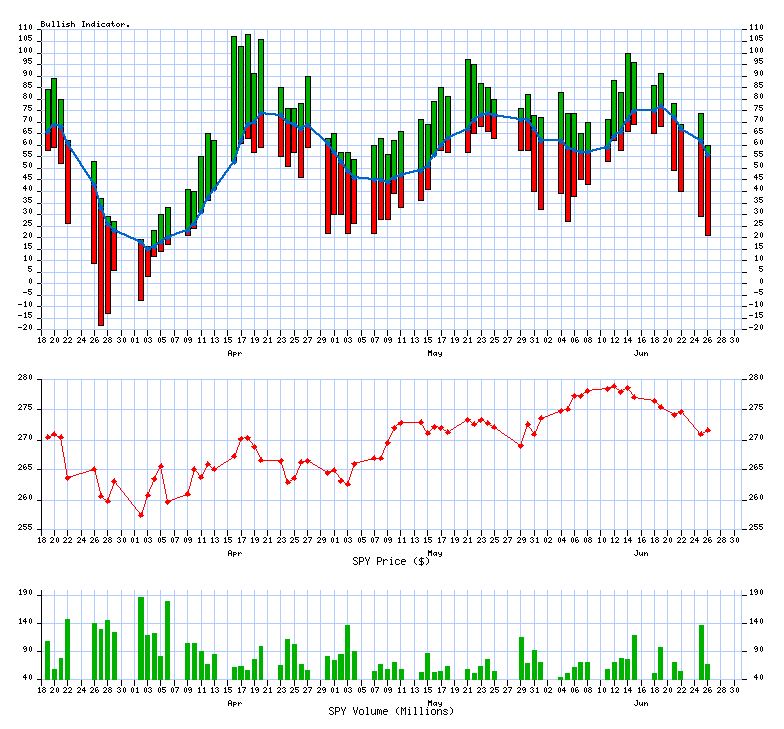
| 41% are trading Bullish (Above 10/20 SMA) | ||||||||
| last successfully ran 06/29/2018 at 06:20 PM | ||||||||
| Upward direction stocks | ||||||||
Description | Symbol | StockTA | Yahoo | News | ||||
Celgene Corporation | CELG | StockTA | Yahoo | News | ||||
National-Oilwell Varc | NOV | StockTA | Yahoo | News | ||||
Transocean LTD | RIG | StockTA | Yahoo | News | ||||
Stericycle Inc | SRCL | StockTA | Yahoo | News | ||||
| Downward direction stocks | ||||||||
Description | Symbol | StockTA | Yahoo | News | ||||
American Internationa | AIG | StockTA | Yahoo | News | ||||
Akamai Technologies, | AKAM | StockTA | Yahoo | News | ||||
Alaska Air Group, Inc | ALK | StockTA | Yahoo | News | ||||
Ameriprise Financial, | AMP | StockTA | Yahoo | News | ||||
ConAgra Foods Inc | CAG | StockTA | Yahoo | News | ||||
Fiserv Inc | FISV | StockTA | Yahoo | News | ||||
General Growth Proper | GGP | StockTA | Yahoo | News | ||||
HCA Holdings Inc | HCA | StockTA | Yahoo | News | ||||
Humana Inc | HUM | StockTA | Yahoo | News | ||||
Ingersoll-Rand PLC | IR | StockTA | Yahoo | News | ||||
The Coca-Cola Co | KO | StockTA | Yahoo | News | ||||
Eli Lilly and Co | LLY | StockTA | Yahoo | News | ||||
McKesson Corporation | MCK | StockTA | Yahoo | News | ||||
Nielsen N.V. Ordinary | NLSN | StockTA | Yahoo | News | ||||
News Corp | NWSA | StockTA | Yahoo | News | ||||
O'Reilly Automotive I | ORLY | StockTA | Yahoo | News | ||||
Robert Half Internati | RHI | StockTA | Yahoo | News | ||||
S&P Global Inc | SPGI | StockTA | Yahoo | News | ||||
Teradata Corporation | TDC | StockTA | Yahoo | News | ||||
Tyson Foods, Inc. | TSN | StockTA | Yahoo | News | ||||
Wyndham Worldwide Cor | WYN | StockTA | Yahoo | News | ||||
Bullish comma separated list (upfile.txt) | ||||||||
Bearish comma separated list (downfile.txt) | ||||||||
| ||||||||
VIX Indicator | ||||||||
VIX Value (06/28/2018) = 16.85 | ||||||||
| 4 year historical Low | 4 year historical High | |||||||
| 9.14 | 37.32 | |||||||

Distribution Charts | |
The current value is: 41 | |
| the median value: 56 | the median value: 64 |
| 4.0 Years | 364 Past Calendar Days |
Trending Charts (Winning / Losing Streak) | |
The chart has been trending down for 7 days | |
| 4.0 Years | 364 Past Calendar Days |
__._,_.___
<*> To unsubscribe from this group, send an email to:
brian@coxintl.com
| xsProfits Website | Investools | Think Or Swim |
| 10/20 day MA daily table | 10/20 MA Breakout | Bullish Percent Index |
__,_._,___