Friday, September 29, 2017

Daily xs Indicator Report (beta)

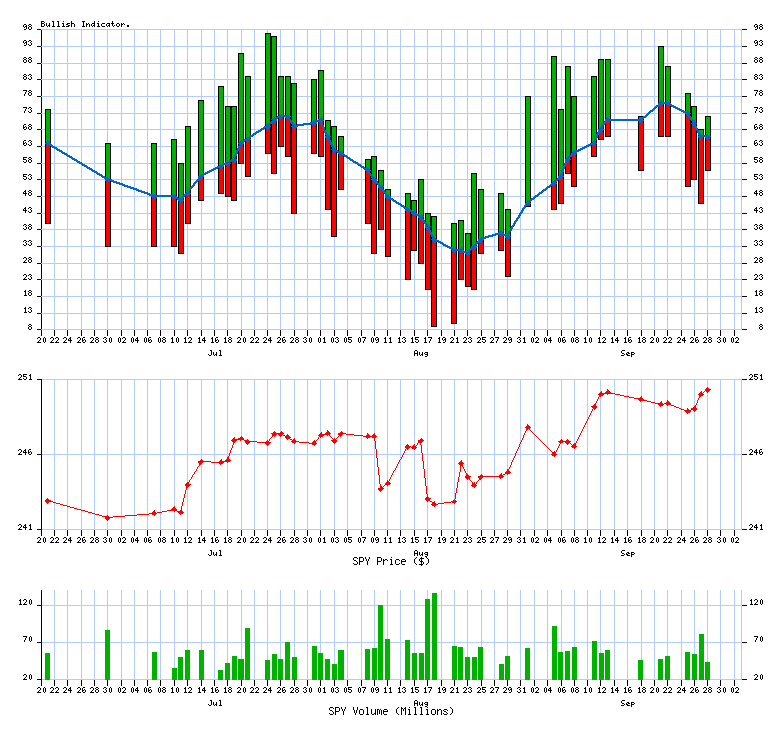
64% are trading Bullish (Above 10/20 SMA)
last successfully ran 09/29/2017 at 06:11 PM
Upward direction stocks

Description

 Symbol StockTA Yahoo News

Alphabet Inc

 GOOG  StockTA   Yahoo   News

Alphabet Inc

 GOOGL  StockTA   Yahoo   News

Public Service Enterp

 PEG  StockTA   Yahoo   News

Zimmer Biomet Holding

 ZBH  StockTA   Yahoo   News
 
Downward direction stocks

Description

 Symbol StockTA  Yahoo News

Agilent Technologies

  A   StockTA   Yahoo   News

AES Corp

  AES   StockTA   Yahoo   News

Baxter International

  BAX   StockTA   Yahoo   News

Estee Lauder Companie

  EL   StockTA   Yahoo   News

Intuitive Surgical, I

  ISRG   StockTA   Yahoo   News

Johnson & Johnson

  JNJ   StockTA   Yahoo   News

Macerich Co

  MAC   StockTA   Yahoo   News

Microsoft Corporation

  MSFT   StockTA   Yahoo   News

Nike Inc

  NKE   StockTA   Yahoo   News

Signet Jewelers Ltd.

  SIG   StockTA   Yahoo   News

J M Smucker Co

  SJM   StockTA   Yahoo   News

Wal-Mart Stores, Inc.

  WMT   StockTA   Yahoo   News
4 Bullish Crossing(s) today
-12 Bearish Crossing(s) today

Bullish comma separated list (upfile.txt)

Bearish comma separated list (downfile.txt)


VIX Indicator

VIX Value (09/28/2017) = 9.55

4 year historical Low

4 year historical High
9.3628.14


What is the VIX?


Distribution Charts

The current value is: 64

the median value: 55the median value: 58
4.0 Years364 Past Calendar Days

Trending Charts (Winning / Losing Streak)

The chart has been trending down for 5 days

4.0 Years364 Past Calendar Days

Copyright © 2007-2017 xsProfits All Rights Reserved | Privacy Policy__._,_.___


<*> To unsubscribe from this group, send an email to:
    brian@coxintl.com


xsProfits Website Investools Think Or Swim
10/20 day MA daily table 10/20 MA Breakout Bullish Percent Index


__,_._,___

Thursday, September 28, 2017

Daily xs Indicator Report (beta)

66% are trading Bullish (Above 10/20 SMA)
last successfully ran 09/28/2017 at 06:09 PM
Upward direction stocks

Description

 Symbol StockTA Yahoo News

BB&T Corporation

 BBT  StockTA   Yahoo   News

Discovery Communicati

 DISCK  StockTA   Yahoo   News

Lennar Corporation

 LEN  StockTA   Yahoo   News

NRG Energy Inc

 NRG  StockTA   Yahoo   News

Nucor Corporation

 NUE  StockTA   Yahoo   News

Viacom, Inc.

 VIAB  StockTA   Yahoo   News
 
Downward direction stocks

Description

 Symbol StockTA  Yahoo News

Global Payments Inc

  GPN   StockTA   Yahoo   News

Realty Income Corp

  O   StockTA   Yahoo   News

ONEOK, Inc.

  OKE   StockTA   Yahoo   News

Procter & Gamble Co

  PG   StockTA   Yahoo   News

Southern Co

  SO   StockTA   Yahoo   News

Stryker Corporation

  SYK   StockTA   Yahoo   News

Thermo Fisher Scienti

  TMO   StockTA   Yahoo   News

Visa Inc

  V   StockTA   Yahoo   News

Zimmer Biomet Holding

  ZBH   StockTA   Yahoo   News

Zoetis Inc

  ZTS   StockTA   Yahoo   News
6 Bullish Crossing(s) today
-10 Bearish Crossing(s) today

Bullish comma separated list (upfile.txt)

Bearish comma separated list (downfile.txt)


VIX Indicator

VIX Value (09/27/2017) = 9.87

4 year historical Low

4 year historical High
9.3628.14


What is the VIX?


Distribution Charts

The current value is: 66

the median value: 55the median value: 57
4.0 Years364 Past Calendar Days

Trending Charts (Winning / Losing Streak)

The chart has been trending down for 4 days

4.0 Years364 Past Calendar Days

Copyright © 2007-2017 xsProfits All Rights Reserved | Privacy Policy__._,_.___


<*> To unsubscribe from this group, send an email to:
    brian@coxintl.com


xsProfits Website Investools Think Or Swim
10/20 day MA daily table 10/20 MA Breakout Bullish Percent Index


__,_._,___

Wednesday, September 27, 2017

Daily xs Indicator Report (beta)

66% are trading Bullish (Above 10/20 SMA)
last successfully ran 09/27/2017 at 06:39 PM
Upward direction stocks

Description

 Symbol StockTA Yahoo News

H & R Block Inc

 HRB  StockTA   Yahoo   News

United Technologies C

 UTX  StockTA   Yahoo   News
 
Downward direction stocks

Description

 Symbol StockTA  Yahoo News

Alaska Air Group, Inc

  ALK   StockTA   Yahoo   News

Alexion Pharmaceutica

  ALXN   StockTA   Yahoo   News

Best Buy Co Inc

  BBY   StockTA   Yahoo   News

Biogen Inc

  BIIB   StockTA   Yahoo   News

ConAgra Foods Inc

  CAG   StockTA   Yahoo   News

CIGNA Corporation

  CI   StockTA   Yahoo   News

General Growth Proper

  GGP   StockTA   Yahoo   News

Gilead Sciences, Inc.

  GILD   StockTA   Yahoo   News

HCA Holdings Inc

  HCA   StockTA   Yahoo   News

The Coca-Cola Co

  KO   StockTA   Yahoo   News

McKesson Corporation

  MCK   StockTA   Yahoo   News

Owens-Illinois Inc

  OI   StockTA   Yahoo   News

Priceline Group Inc

  PCLN   StockTA   Yahoo   News

Ralph Lauren Corp

  RL   StockTA   Yahoo   News

Constellation Brands,

  STZ   StockTA   Yahoo   News

Under Armour Inc

  UA   StockTA   Yahoo   News

Universal Health Serv

  UHS   StockTA   Yahoo   News

Varian Medical System

  VAR   StockTA   Yahoo   News

Waters Corporation

  WAT   StockTA   Yahoo   News

WestRock Co

  WRK   StockTA   Yahoo   News
2 Bullish Crossing(s) today
-20 Bearish Crossing(s) today

Bullish comma separated list (upfile.txt)

Bearish comma separated list (downfile.txt)


VIX Indicator

VIX Value (09/26/2017) = 10.17

4 year historical Low

4 year historical High
9.3628.14


What is the VIX?


Distribution Charts

The current value is: 66

the median value: 55the median value: 57
4.0 Years364 Past Calendar Days

Trending Charts (Winning / Losing Streak)

The chart has been trending down for 3 days

4.0 Years364 Past Calendar Days

Copyright © 2007-2017 xsProfits All Rights Reserved | Privacy Policy__._,_.___


<*> To unsubscribe from this group, send an email to:
    brian@coxintl.com


xsProfits Website Investools Think Or Swim
10/20 day MA daily table 10/20 MA Breakout Bullish Percent Index


__,_._,___

Tuesday, September 26, 2017

Daily xs Indicator Report (beta)

70% are trading Bullish (Above 10/20 SMA)
last successfully ran 09/26/2017 at 06:14 PM
Upward direction stocks

Description

 Symbol StockTA Yahoo News

Chipotle Mexican Gril

 CMG  StockTA   Yahoo   News

Hasbro, Inc.

 HAS  StockTA   Yahoo   News

Hewlett Packard Enter

 HPE  StockTA   Yahoo   News

Altria Group Inc

 MO  StockTA   Yahoo   News

Tegna Inc

 TGNA  StockTA   Yahoo   News
 
Downward direction stocks

Description

 Symbol StockTA  Yahoo News

AmerisourceBergen Cor

  ABC   StockTA   Yahoo   News

Amazon.com, Inc.

  AMZN   StockTA   Yahoo   News

CenterPoint Energy, I

  CNP   StockTA   Yahoo   News

Rockwell Collins, Inc

  COL   StockTA   Yahoo   News

CSRA Inc

  CSRA   StockTA   Yahoo   News

Endo International pl

  ENDP   StockTA   Yahoo   News

Hanesbrands Inc.

  HBI   StockTA   Yahoo   News

Illumina, Inc.

  ILMN   StockTA   Yahoo   News

Lennar Corporation

  LEN   StockTA   Yahoo   News

Medtronic PLC

  MDT   StockTA   Yahoo   News

Mohawk Industries, In

  MHK   StockTA   Yahoo   News

Monster Beverage Corp

  MNST   StockTA   Yahoo   News

Mylan NV

  MYL   StockTA   Yahoo   News

Skyworks Solutions In

  SWKS   StockTA   Yahoo   News

Tripadvisor Inc

  TRIP   StockTA   Yahoo   News

Ulta Salon, Cosmetics

  ULTA   StockTA   Yahoo   News

Ventas, Inc.

  VTR   StockTA   Yahoo   News
5 Bullish Crossing(s) today
-17 Bearish Crossing(s) today

Bullish comma separated list (upfile.txt)

Bearish comma separated list (downfile.txt)


VIX Indicator

VIX Value (09/25/2017) = 10.21

4 year historical Low

4 year historical High
9.3628.14


What is the VIX?


Distribution Charts

The current value is: 70

the median value: 55the median value: 57
4.0 Years364 Past Calendar Days

Trending Charts (Winning / Losing Streak)

The chart has been trending down for 2 days

4.0 Years364 Past Calendar Days

Copyright © 2007-2017 xsProfits All Rights Reserved | Privacy Policy__._,_.___


<*> To unsubscribe from this group, send an email to:
    brian@coxintl.com


xsProfits Website Investools Think Or Swim
10/20 day MA daily table 10/20 MA Breakout Bullish Percent Index


__,_._,___

Monday, September 25, 2017

Daily xs Indicator Report (beta)

73% are trading Bullish (Above 10/20 SMA)
last successfully ran 09/25/2017 at 06:10 PM
Upward direction stocks

Description

 Symbol StockTA Yahoo News

Best Buy Co Inc

 BBY  StockTA   Yahoo   News

Cincinnati Financial

 CINF  StockTA   Yahoo   News

F5 Networks, Inc.

 FFIV  StockTA   Yahoo   News

Twenty-First Century

 FOX  StockTA   Yahoo   News

Twenty-First Century

 FOXA  StockTA   Yahoo   News

General Electric Comp

 GE  StockTA   Yahoo   News
 
Downward direction stocks

Description

 Symbol StockTA  Yahoo News

Adobe Systems Incorpo

  ADBE   StockTA   Yahoo   News

Autodesk, Inc.

  ADSK   StockTA   Yahoo   News

Aetna Inc

  AET   StockTA   Yahoo   News

Activision Blizzard,

  ATVI   StockTA   Yahoo   News

CA, Inc.

  CA   StockTA   Yahoo   News

Cardinal Health Inc

  CAH   StockTA   Yahoo   News

salesforce.com, inc.

  CRM   StockTA   Yahoo   News

Dr Pepper Snapple Gro

  DPS   StockTA   Yahoo   News

Electronic Arts Inc.

  EA   StockTA   Yahoo   News

Express Scripts Holdi

  ESRX   StockTA   Yahoo   News

Facebook Inc

  FB   StockTA   Yahoo   News

General Mills, Inc.

  GIS   StockTA   Yahoo   News

Alphabet Inc

  GOOGL   StockTA   Yahoo   News

Welltower Inc

  HCN   StockTA   Yahoo   News

Kellogg Company

  K   StockTA   Yahoo   News

Kimco Realty Corp

  KIM   StockTA   Yahoo   News

Patterson Companies,

  PDCO   StockTA   Yahoo   News

PPL Corp

  PPL   StockTA   Yahoo   News

PVH Corp

  PVH   StockTA   Yahoo   News

Qorvo Inc

  QRVO   StockTA   Yahoo   News

Tiffany & Co.

  TIF   StockTA   Yahoo   News

Yum! Brands, Inc.

  YUM   StockTA   Yahoo   News
6 Bullish Crossing(s) today
-22 Bearish Crossing(s) today

Bullish comma separated list (upfile.txt)

Bearish comma separated list (downfile.txt)


VIX Indicator

VIX Value (09/22/2017) = 9.59

4 year historical Low

4 year historical High
9.3628.14


What is the VIX?


Distribution Charts

The current value is: 73

the median value: 55the median value: 57
4.0 Years364 Past Calendar Days

Trending Charts (Winning / Losing Streak)

The trend has changed to down today

4.0 Years364 Past Calendar Days

Copyright © 2007-2017 xsProfits All Rights Reserved | Privacy Policy__._,_.___


<*> To unsubscribe from this group, send an email to:
    brian@coxintl.com


xsProfits Website Investools Think Or Swim
10/20 day MA daily table 10/20 MA Breakout Bullish Percent Index


__,_._,___