Monday, April 27, 2020

Daily xs Indicator Report (beta)

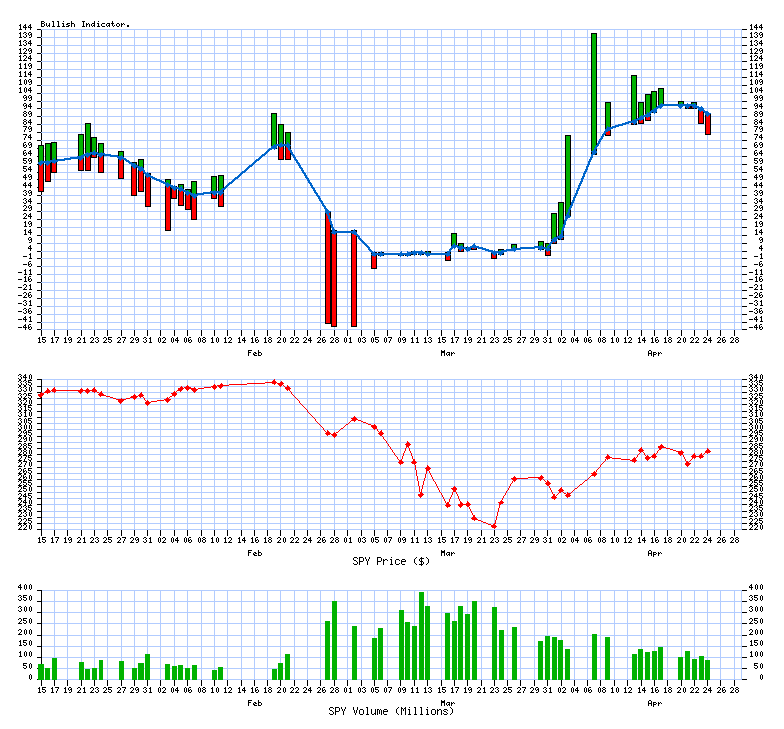
88% are trading Bullish (Above 10/20 SMA)
last successfully ran 04/27/2020 at 06:06 PM
Upward direction stocks

Description

 Symbol StockTA Yahoo News

American Airlines Gro

 AAL  StockTA   Yahoo   News

Discover Financial Se

 DFS  StockTA   Yahoo   News

Delphi Automotive PLC

 DLPH  StockTA   Yahoo   News
 
Downward direction stocks

Description

 Symbol StockTA  Yahoo News

Acuity Brands, Inc.

  AYI   StockTA   Yahoo   News

Flowserve Corp

  FLS   StockTA   Yahoo   News

Federal Realty Invest

  FRT   StockTA   Yahoo   News

Huntington Bancshares

  HBAN   StockTA   Yahoo   News

International Paper C

  IP   StockTA   Yahoo   News

Jacobs Engineering Gr

  J   StockTA   Yahoo   News

LyondellBasell Indust

  LYB   StockTA   Yahoo   News

Martin Marietta Mater

  MLM   StockTA   Yahoo   News

Northern Trust Corpor

  NTRS   StockTA   Yahoo   News

News Corp

  NWSA   StockTA   Yahoo   News

Omnicom Group Inc.

  OMC   StockTA   Yahoo   News

Transocean LTD

  RIG   StockTA   Yahoo   News

Ralph Lauren Corp

  RL   StockTA   Yahoo   News
3 Bullish Crossing(s) today
-13 Bearish Crossing(s) today

Bullish comma separated list (upfile.txt)

Bearish comma separated list (downfile.txt)


VIX Indicator

VIX Value (04/27/2020) = 33.29

4 year historical Low

4 year historical High
10.8582.69


What is the VIX?


Distribution Charts

The current value is: 88

the median value: 59the median value: 60
4.0 Years364 Past Calendar Days

Trending Charts (Winning / Losing Streak)

The chart has been trending down for 3 days

4.0 Years364 Past Calendar Days

Copyright © 2007-2020 xsProfits All Rights Reserved | Privacy Policy__._,_.___


<*> To unsubscribe from this group, send an email to:
    brian@coxintl.com


xsProfits Website ThinkOrSwim
10/20 day MA daily table 10/20 MA Breakout Bullish Percent Index


__,_._,___

Friday, April 24, 2020

Daily xs Indicator Report (beta)

91% are trading Bullish (Above 10/20 SMA)
last successfully ran 04/24/2020 at 06:19 PM
Upward direction stocks

Description

 Symbol StockTA Yahoo News
 
No Upward directional stocks found today
 
 
Downward direction stocks

Description

 Symbol StockTA  Yahoo News

Assurant, Inc.

  AIZ   StockTA   Yahoo   News

American Express Comp

  AXP   StockTA   Yahoo   News

Comerica Incorporated

  CMA   StockTA   Yahoo   News

Discover Financial Se

  DFS   StockTA   Yahoo   News

Invesco Ltd.

  IVZ   StockTA   Yahoo   News

Kimco Realty Corp

  KIM   StockTA   Yahoo   News

Loews Corporation

  L   StockTA   Yahoo   News

L Brands Inc

  LB   StockTA   Yahoo   News

Navient Corp

  NAVI   StockTA   Yahoo   News

Omnicom Group Inc.

  OMC   StockTA   Yahoo   News

Public Storage

  PSA   StockTA   Yahoo   News

U.S. Bancorp

  USB   StockTA   Yahoo   News

Western Digital Corp

  WDC   StockTA   Yahoo   News
0 Bullish Crossing(s) today
-13 Bearish Crossing(s) today

Bullish comma separated list (upfile.txt)

Bearish comma separated list (downfile.txt)


VIX Indicator

VIX Value (04/24/2020) = 35.93

4 year historical Low

4 year historical High
10.8582.69


What is the VIX?


Distribution Charts

The current value is: 91

the median value: 59the median value: 60
4.0 Years364 Past Calendar Days

Trending Charts (Winning / Losing Streak)

The chart has been trending down for 2 days

4.0 Years364 Past Calendar Days

Copyright © 2007-2020 xsProfits All Rights Reserved | Privacy Policy__._,_.___


<*> To unsubscribe from this group, send an email to:
    brian@coxintl.com


xsProfits Website ThinkOrSwim
10/20 day MA daily table 10/20 MA Breakout Bullish Percent Index


__,_._,___

Thursday, April 23, 2020

Daily xs Indicator Report (beta)

94% are trading Bullish (Above 10/20 SMA)
last successfully ran 04/23/2020 at 06:04 PM
Upward direction stocks

Description

 Symbol StockTA Yahoo News
 
No Upward directional stocks found today
 
 
Downward direction stocks

Description

 Symbol StockTA  Yahoo News

AES Corp

  AES   StockTA   Yahoo   News

Caterpillar Inc.

  CAT   StockTA   Yahoo   News

Deere & Company

  DE   StockTA   Yahoo   News

Hewlett Packard Enter

  HPE   StockTA   Yahoo   News

Nielsen N.V. Ordinary

  NLSN   StockTA   Yahoo   News

Newell Brands Inc

  NWL   StockTA   Yahoo   News

Owens-Illinois Inc

  OI   StockTA   Yahoo   News

Tiffany & Co.

  TIF   StockTA   Yahoo   News

Wells Fargo & Co

  WFC   StockTA   Yahoo   News
0 Bullish Crossing(s) today
-9 Bearish Crossing(s) today

Bullish comma separated list (upfile.txt)

Bearish comma separated list (downfile.txt)


VIX Indicator

VIX Value (04/23/2020) = 41.38

4 year historical Low

4 year historical High
10.8582.69


What is the VIX?


Distribution Charts

The current value is: 94

the median value: 59the median value: 60
4.0 Years364 Past Calendar Days

Trending Charts (Winning / Losing Streak)

The trend has changed to down today

4.0 Years364 Past Calendar Days

Copyright © 2007-2020 xsProfits All Rights Reserved | Privacy Policy__._,_.___


<*> To unsubscribe from this group, send an email to:
    brian@coxintl.com


xsProfits Website ThinkOrSwim
10/20 day MA daily table 10/20 MA Breakout Bullish Percent Index


__,_._,___

Wednesday, April 22, 2020

Daily xs Indicator Report (beta)

96% are trading Bullish (Above 10/20 SMA)
last successfully ran 04/22/2020 at 06:03 PM
Upward direction stocks

Description

 Symbol StockTA Yahoo News

Carnival Corp

 CCL  StockTA   Yahoo   News

Patterson Companies,

 PDCO  StockTA   Yahoo   News
 
Downward direction stocks

Description

 Symbol StockTA  Yahoo News

Extra Space Storage,

  EXR   StockTA   Yahoo   News

Interpublic Group of

  IPG   StockTA   Yahoo   News
2 Bullish Crossing(s) today
-2 Bearish Crossing(s) today

Bullish comma separated list (upfile.txt)

Bearish comma separated list (downfile.txt)


VIX Indicator

VIX Value (04/22/2020) = 41.98

4 year historical Low

4 year historical High
10.8582.69


What is the VIX?


Distribution Charts

The current value is: 96

the median value: 59the median value: 60
4.0 Years364 Past Calendar Days

Trending Charts (Winning / Losing Streak)

The chart has been trending up for 13 days

4.0 Years364 Past Calendar Days

Copyright © 2007-2020 xsProfits All Rights Reserved | Privacy Policy__._,_.___


<*> To unsubscribe from this group, send an email to:
    brian@coxintl.com


xsProfits Website ThinkOrSwim
10/20 day MA daily table 10/20 MA Breakout Bullish Percent Index


__,_._,___

Tuesday, April 21, 2020

Daily xs Indicator Report (beta)

96% are trading Bullish (Above 10/20 SMA)
last successfully ran 04/21/2020 at 06:37 PM
Upward direction stocks

Description

 Symbol StockTA Yahoo News
 
No Upward directional stocks found today
 
 
Downward direction stocks

Description

 Symbol StockTA  Yahoo News

Boeing Co

  BA   StockTA   Yahoo   News

Xerox Corp

  XRX   StockTA   Yahoo   News
0 Bullish Crossing(s) today
-2 Bearish Crossing(s) today

Bullish comma separated list (upfile.txt)

Bearish comma separated list (downfile.txt)


VIX Indicator

VIX Value (04/21/2020) = 45.41

4 year historical Low

4 year historical High
10.8582.69


What is the VIX?


Distribution Charts

The current value is: 96

the median value: 59the median value: 60
4.0 Years364 Past Calendar Days

Trending Charts (Winning / Losing Streak)

The chart has been trending up for 12 days

4.0 Years364 Past Calendar Days

Copyright © 2007-2020 xsProfits All Rights Reserved | Privacy Policy__._,_.___


<*> To unsubscribe from this group, send an email to:
    brian@coxintl.com


xsProfits Website ThinkOrSwim
10/20 day MA daily table 10/20 MA Breakout Bullish Percent Index


__,_._,___

Daily xs Indicator Report (beta)

96% are trading Bullish (Above 10/20 SMA)
last successfully ran 04/21/2020 at 06:04 PM
Upward direction stocks

Description

 Symbol StockTA Yahoo News
 
No Upward directional stocks found today
 
 
Downward direction stocks

Description

 Symbol StockTA  Yahoo News

Boeing Co

  BA   StockTA   Yahoo   News

Xerox Corp

  XRX   StockTA   Yahoo   News
0 Bullish Crossing(s) today
-2 Bearish Crossing(s) today

Bullish comma separated list (upfile.txt)

Bearish comma separated list (downfile.txt)


VIX Indicator

VIX Value (04/21/2020) = 45.41

4 year historical Low

4 year historical High
10.8582.69


What is the VIX?


Distribution Charts

The current value is: 96

the median value: 59the median value: 60
4.0 Years364 Past Calendar Days

Trending Charts (Winning / Losing Streak)

The chart has been trending up for 12 days

4.0 Years364 Past Calendar Days

Copyright © 2007-2020 xsProfits All Rights Reserved | Privacy Policy__._,_.___


<*> To unsubscribe from this group, send an email to:
    brian@coxintl.com


xsProfits Website ThinkOrSwim
10/20 day MA daily table 10/20 MA Breakout Bullish Percent Index


__,_._,___

Monday, April 20, 2020

Daily xs Indicator Report (beta)

96% are trading Bullish (Above 10/20 SMA)
last successfully ran 04/20/2020 at 06:03 PM
Upward direction stocks

Description

 Symbol StockTA Yahoo News

Kimco Realty Corp

 KIM  StockTA   Yahoo   News

People's United Finan

 PBCT  StockTA   Yahoo   News

Walgreens Boots Allia

 WBA  StockTA   Yahoo   News
 
Downward direction stocks

Description

 Symbol StockTA  Yahoo News
 
No Downward directional stocks found today
 
3 Bullish Crossing(s) today
0 Bearish Crossing(s) today

Bullish comma separated list (upfile.txt)

Bearish comma separated list (downfile.txt)


VIX Indicator

VIX Value (04/20/2020) = 43.83

4 year historical Low

4 year historical High
10.8582.69


What is the VIX?


Distribution Charts

The current value is: 96

the median value: 59the median value: 60
4.0 Years364 Past Calendar Days

Trending Charts (Winning / Losing Streak)

The chart has been trending up for 11 days

4.0 Years364 Past Calendar Days

Copyright © 2007-2020 xsProfits All Rights Reserved | Privacy Policy__._,_.___


<*> To unsubscribe from this group, send an email to:
    brian@coxintl.com


xsProfits Website ThinkOrSwim
10/20 day MA daily table 10/20 MA Breakout Bullish Percent Index


__,_._,___

Friday, April 17, 2020

Daily xs Indicator Report (beta)

96% are trading Bullish (Above 10/20 SMA)
last successfully ran 04/17/2020 at 06:03 PM
Upward direction stocks

Description

 Symbol StockTA Yahoo News

Comerica Incorporated

 CMA  StockTA   Yahoo   News

Corning Incorporated

 GLW  StockTA   Yahoo   News

Harley-Davidson Inc

 HOG  StockTA   Yahoo   News

H & R Block Inc

 HRB  StockTA   Yahoo   News

Host Hotels and Resor

 HST  StockTA   Yahoo   News

Marriott Internationa

 MAR  StockTA   Yahoo   News

Realty Income Corp

 O  StockTA   Yahoo   News

Pitney Bowes Inc.

 PBI  StockTA   Yahoo   News

Principal Financial G

 PFG  StockTA   Yahoo   News

Signet Jewelers Ltd.

 SIG  StockTA   Yahoo   News

Tripadvisor Inc

 TRIP  StockTA   Yahoo   News
 
Downward direction stocks

Description

 Symbol StockTA  Yahoo News
 
No Downward directional stocks found today
 
11 Bullish Crossing(s) today
0 Bearish Crossing(s) today

Bullish comma separated list (upfile.txt)

Bearish comma separated list (downfile.txt)


VIX Indicator

VIX Value (04/17/2020) = 38.15

4 year historical Low

4 year historical High
10.8582.69


What is the VIX?


Distribution Charts

The current value is: 96

the median value: 59the median value: 59
4.0 Years364 Past Calendar Days

Trending Charts (Winning / Losing Streak)

The chart has been trending up for 10 days

4.0 Years364 Past Calendar Days

Copyright © 2007-2020 xsProfits All Rights Reserved | Privacy Policy__._,_.___


<*> To unsubscribe from this group, send an email to:
    brian@coxintl.com


xsProfits Website ThinkOrSwim
10/20 day MA daily table 10/20 MA Breakout Bullish Percent Index


__,_._,___