Tuesday, September 30, 2014

Daily xs Indicator Report (beta)

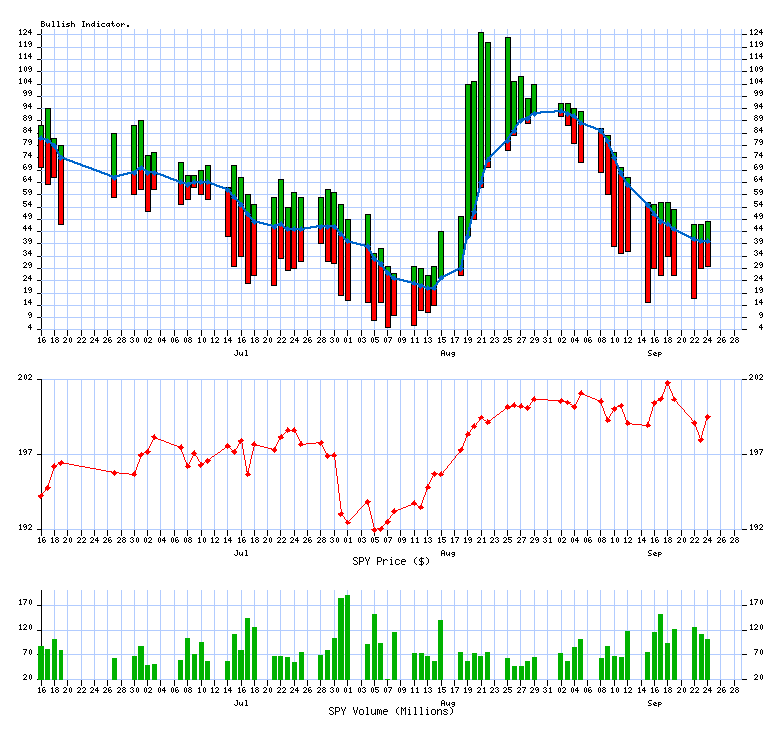
31% are trading Bullish (Above 10/20 SMA)
last successfully ran 09/30/2014 at 03:09 PM
Upward direction stocks

Description

 Symbol StockTA Yahoo News

Analog Devices, Inc.

 ADI  StockTA   Yahoo   News

CenturyLink, Inc.

 CTL  StockTA   Yahoo   News

eBay Inc

 EBAY  StockTA   Yahoo   News

Reynolds American, In

 RAI  StockTA   Yahoo   News

Wynn Resorts, Limited

 WYNN  StockTA   Yahoo   News
 
Downward direction stocks

Description

 Symbol StockTA  Yahoo News

Abbott Laboratories

  ABT   StockTA   Yahoo   News

Bed Bath & Beyond Inc

  BBBY   StockTA   Yahoo   News

Covidien plc

  COV   StockTA   Yahoo   News

Cisco Systems, Inc.

  CSCO   StockTA   Yahoo   News

CVS Caremark Corporat

  CVS   StockTA   Yahoo   News

EMC Corporation

  EMC   StockTA   Yahoo   News

FirstEnergy Corp.

  FE   StockTA   Yahoo   News

General Electric Comp

  GE   StockTA   Yahoo   News

Huntington Bancshares

  HBAN   StockTA   Yahoo   News

Hudson City Bancorp,

  HCBK   StockTA   Yahoo   News

Mastercard Inc

  MA   StockTA   Yahoo   News

3M Co

  MMM   StockTA   Yahoo   News

Noble Energy, Inc.

  NBL   StockTA   Yahoo   News

Precision Castparts C

  PCP   StockTA   Yahoo   News

QUALCOMM, Inc.

  QCOM   StockTA   Yahoo   News

Staples, Inc.

  SPLS   StockTA   Yahoo   News

Tyson Foods, Inc.

  TSN   StockTA   Yahoo   News

UnitedHealth Group In

  UNH   StockTA   Yahoo   News

Wal-Mart Stores, Inc.

  WMT   StockTA   Yahoo   News

Zimmer Holdings, Inc.

  ZMH   StockTA   Yahoo   News
5 Bullish Crossing(s) today
-20 Bearish Crossing(s) today

Bullish comma separated list (upfile.txt)

Bearish comma separated list (downfile.txt)


VIX Indicator

VIX Value (09/29/2014) = 15.98

4 year historical Low

4 year historical High
10.2848.00


What is the VIX?


Distribution Charts

The current value is: 31

the median value: 63the median value: 58
4.0 Years364 Past Calendar Days

Trending Charts (Winning / Losing Streak)

The chart has been trending down for 19 days

4.0 Years364 Past Calendar Days

Copyright © 2007-2014 xsProfits All Rights Reserved | Privacy Policy__._,_.___


<*> To unsubscribe from this group, send an email to:
    brian@coxintl.com


xsProfits Website Investools Think Or Swim
10/20 day MA daily table 10/20 MA Breakout Bullish Percent Index


__,_._,___

Monday, September 29, 2014

Daily xs Indicator Report (beta)

34% are trading Bullish (Above 10/20 SMA)
last successfully ran 09/29/2014 at 03:09 PM
Upward direction stocks

Description

 Symbol StockTA Yahoo News

Biogen Idec Inc.

 BIIB  StockTA   Yahoo   News

Celgene Corporation

 CELG  StockTA   Yahoo   News

Duke Energy Corp

 DUK  StockTA   Yahoo   News

Gilead Sciences, Inc.

 GILD  StockTA   Yahoo   News

Kimberly Clark Corp

 KMB  StockTA   Yahoo   News

McKesson Corporation

 MCK  StockTA   Yahoo   News

Micron Technology, In

 MU  StockTA   Yahoo   News

Noble Energy, Inc.

 NBL  StockTA   Yahoo   News

UnitedHealth Group In

 UNH  StockTA   Yahoo   News
 
Downward direction stocks

Description

 Symbol StockTA  Yahoo News

Akamai Technologies,

  AKAM   StockTA   Yahoo   News

The Bank of New York

  BK   StockTA   Yahoo   News

CareFusion Corporatio

  CFN   StockTA   Yahoo   News

Comcast Corporation

  CMCSA   StockTA   Yahoo   News

Citrix Systems, Inc.

  CTXS   StockTA   Yahoo   News

KeyCorp

  KEY   StockTA   Yahoo   News

Masco Corporation

  MAS   StockTA   Yahoo   News

Medtronic, Inc.

  MDT   StockTA   Yahoo   News

Metlife Inc

  MET   StockTA   Yahoo   News

PHV Corp

  PVH   StockTA   Yahoo   News

Stanley Black & Decke

  SWK   StockTA   Yahoo   News

Total System Services

  TSS   StockTA   Yahoo   News

Whirlpool Corporation

  WHR   StockTA   Yahoo   News
9 Bullish Crossing(s) today
-13 Bearish Crossing(s) today

Bullish comma separated list (upfile.txt)

Bearish comma separated list (downfile.txt)


VIX Indicator

VIX Value (09/26/2014) = 14.85

4 year historical Low

4 year historical High
10.2848.00


What is the VIX?


Distribution Charts

The current value is: 34

the median value: 63the median value: 59
4.0 Years364 Past Calendar Days

Trending Charts (Winning / Losing Streak)

The chart has been trending down for 18 days

4.0 Years364 Past Calendar Days

Copyright © 2007-2014 xsProfits All Rights Reserved | Privacy Policy__._,_.___


<*> To unsubscribe from this group, send an email to:
    brian@coxintl.com


xsProfits Website Investools Think Or Swim
10/20 day MA daily table 10/20 MA Breakout Bullish Percent Index


__,_._,___

Friday, September 26, 2014

Daily xs Indicator Report (beta)

36% are trading Bullish (Above 10/20 SMA)
last successfully ran 09/26/2014 at 03:06 PM
Upward direction stocks

Description

 Symbol StockTA Yahoo News

Bed Bath & Beyond Inc

 BBBY  StockTA   Yahoo   News

The Coca-Cola Company

 KO  StockTA   Yahoo   News

Monsanto Company

 MON  StockTA   Yahoo   News

QUALCOMM, Inc.

 QCOM  StockTA   Yahoo   News

Wal-Mart Stores, Inc.

 WMT  StockTA   Yahoo   News
 
Downward direction stocks

Description

 Symbol StockTA  Yahoo News

Agilent Technologies

  A   StockTA   Yahoo   News

Fiserv, Inc.

  FISV   StockTA   Yahoo   News

International Paper C

  IP   StockTA   Yahoo   News

Moody's Corporation

  MCO   StockTA   Yahoo   News

NASDAQ OMX Group, Inc

  NDAQ   StockTA   Yahoo   News

Time Warner Cable Inc

  TWC   StockTA   Yahoo   News

Walgreen Company

  WAG   StockTA   Yahoo   News
5 Bullish Crossing(s) today
-7 Bearish Crossing(s) today

Bullish comma separated list (upfile.txt)

Bearish comma separated list (downfile.txt)


VIX Indicator

VIX Value (09/25/2014) = 15.64

4 year historical Low

4 year historical High
10.2848.00


What is the VIX?


Distribution Charts

The current value is: 36

the median value: 63the median value: 60
4.0 Years364 Past Calendar Days

Trending Charts (Winning / Losing Streak)

The chart has been trending down for 17 days

4.0 Years364 Past Calendar Days

Copyright © 2007-2014 xsProfits All Rights Reserved | Privacy Policy__._,_.___


<*> To unsubscribe from this group, send an email to:
    brian@coxintl.com


xsProfits Website Investools Think Or Swim
10/20 day MA daily table 10/20 MA Breakout Bullish Percent Index


__,_._,___

Thursday, September 25, 2014

Daily xs Indicator Report (beta)

35% are trading Bullish (Above 10/20 SMA)
last successfully ran 09/25/2014 at 03:13 PM
Upward direction stocks

Description

 Symbol StockTA Yahoo News

Air Products & Chemic

 APD  StockTA   Yahoo   News

Deere & Company

 DE  StockTA   Yahoo   News

Travelers Companies I

 TRV  StockTA   Yahoo   News
 
Downward direction stocks

Description

 Symbol StockTA  Yahoo News

Aetna Inc.

  AET   StockTA   Yahoo   News

Amphenol Corporation

  APH   StockTA   Yahoo   News

Cerner Corporation

  CERN   StockTA   Yahoo   News

Coach, Inc.

  COH   StockTA   Yahoo   News

Cablevision Systems C

  CVC   StockTA   Yahoo   News

D.R. Horton, Inc.

  DHI   StockTA   Yahoo   News

Duke Energy Corp

  DUK   StockTA   Yahoo   News

Expeditors Internatio

  EXPD   StockTA   Yahoo   News

F5 Networks, Inc.

  FFIV   StockTA   Yahoo   News

GameStop Corp.

  GME   StockTA   Yahoo   News

Intuitive Surgical, I

  ISRG   StockTA   Yahoo   News

The Coca-Cola Company

  KO   StockTA   Yahoo   News

Marsh & McLennan Comp

  MMC   StockTA   Yahoo   News

NRG Energy Inc

  NRG   StockTA   Yahoo   News

PulteGroup, Inc.

  PHM   StockTA   Yahoo   News

Pinnacle West Capital

  PNW   StockTA   Yahoo   News

Quanta Services Inc

  PWR   StockTA   Yahoo   News

QUALCOMM, Inc.

  QCOM   StockTA   Yahoo   News

Ryder System, Inc.

  R   StockTA   Yahoo   News

Ralph Lauren Corp

  RL   StockTA   Yahoo   News

Symantec Corporation

  SYMC   StockTA   Yahoo   News

Teradyne, Inc.

  TER   StockTA   Yahoo   News

Thermo Fisher Scienti

  TMO   StockTA   Yahoo   News

UnitedHealth Group In

  UNH   StockTA   Yahoo   News

Visa Inc

  V   StockTA   Yahoo   News

Windstream Corporatio

  WIN   StockTA   Yahoo   News

Xerox Corporation

  XRX   StockTA   Yahoo   News
3 Bullish Crossing(s) today
-27 Bearish Crossing(s) today

Bullish comma separated list (upfile.txt)

Bearish comma separated list (downfile.txt)


VIX Indicator

VIX Value (09/24/2014) = 13.27

4 year historical Low

4 year historical High
10.2848.00


What is the VIX?


Distribution Charts

The current value is: 35

the median value: 63the median value: 60
4.0 Years364 Past Calendar Days

Trending Charts (Winning / Losing Streak)

The chart has been trending down for 17 days

4.0 Years364 Past Calendar Days

Copyright © 2007-2014 xsProfits All Rights Reserved | Privacy Policy__._,_.___


<*> To unsubscribe from this group, send an email to:
    brian@coxintl.com


xsProfits Website Investools Think Or Swim
10/20 day MA daily table 10/20 MA Breakout Bullish Percent Index


__,_._,___

Wednesday, September 24, 2014

Daily xs Indicator Report (beta)

40% are trading Bullish (Above 10/20 SMA)
last successfully ran 09/24/2014 at 03:08 PM
Upward direction stocks

Description

 Symbol StockTA Yahoo News

ACE Limited

 ACE  StockTA   Yahoo   News

CF Industries Holding

 CF  StockTA   Yahoo   News

Coach, Inc.

 COH  StockTA   Yahoo   News

The Home Depot, Inc.

 HD  StockTA   Yahoo   News

Lorillard Inc.

 LO  StockTA   Yahoo   News

Mastercard Inc

 MA  StockTA   Yahoo   News

QUALCOMM, Inc.

 QCOM  StockTA   Yahoo   News

Windstream Corporatio

 WIN  StockTA   Yahoo   News
 
Downward direction stocks

Description

 Symbol StockTA  Yahoo News

Ball Corporation

  BLL   StockTA   Yahoo   News

Boston Scientific Cor

  BSX   StockTA   Yahoo   News

Entergy Corporation

  ETR   StockTA   Yahoo   News

Fastenal Company

  FAST   StockTA   Yahoo   News

Illinois Tool Works I

  ITW   StockTA   Yahoo   News

Leucadia National Cor

  LUK   StockTA   Yahoo   News

Parker-Hannifin Corpo

  PH   StockTA   Yahoo   News

Robert Half Internati

  RHI   StockTA   Yahoo   News

Sealed Air Corp

  SEE   StockTA   Yahoo   News

Stryker Corporation

  SYK   StockTA   Yahoo   News
8 Bullish Crossing(s) today
-10 Bearish Crossing(s) today

Bullish comma separated list (upfile.txt)

Bearish comma separated list (downfile.txt)


VIX Indicator

VIX Value (09/23/2014) = 14.93

4 year historical Low

4 year historical High
10.2848.00


What is the VIX?


Distribution Charts

The current value is: 40

the median value: 63the median value: 60
4.0 Years364 Past Calendar Days

Trending Charts (Winning / Losing Streak)

The chart has been trending down for 16 days

4.0 Years364 Past Calendar Days

Copyright © 2007-2014 xsProfits All Rights Reserved | Privacy Policy__._,_.___


<*> To unsubscribe from this group, send an email to:
    brian@coxintl.com


xsProfits Website Investools Think Or Swim
10/20 day MA daily table 10/20 MA Breakout Bullish Percent Index


__,_._,___