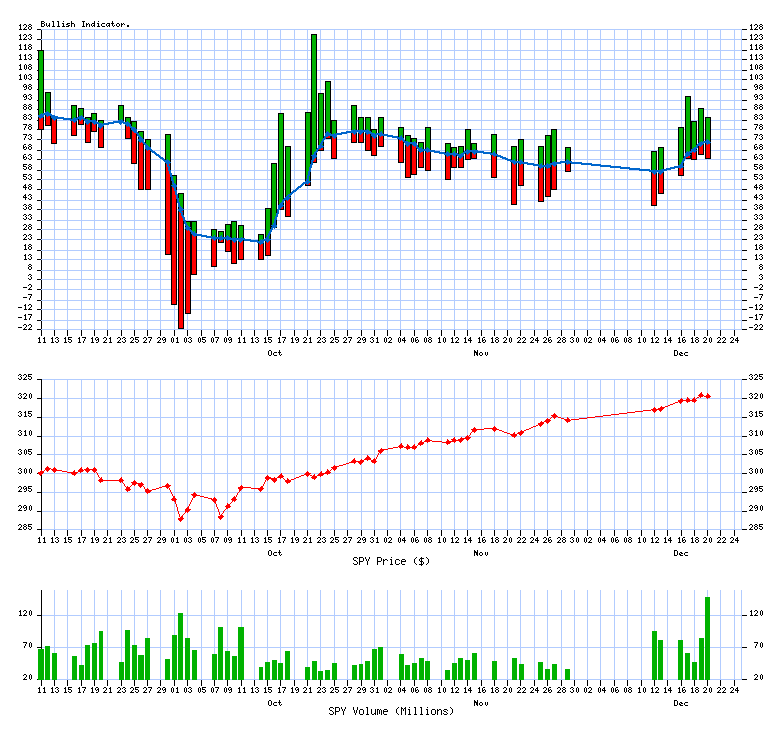
Tuesday, December 31, 2019

Daily xs Indicator Report (beta)

80% are trading Bullish (Above 10/20 SMA)
last successfully ran 12/31/2019 at 06:09 PM
Upward direction stocks

Description

 Symbol StockTA Yahoo News

Assurant, Inc.

 AIZ  StockTA   Yahoo   News

Ball Corporation

 BLL  StockTA   Yahoo   News

General Mills, Inc.

 GIS  StockTA   Yahoo   News
 
Downward direction stocks

Description

 Symbol StockTA  Yahoo News

Cummins Inc.

  CMI   StockTA   Yahoo   News

Expedia Inc

  EXPE   StockTA   Yahoo   News

Hologic, Inc.

  HOLX   StockTA   Yahoo   News

Hewlett Packard Enter

  HPE   StockTA   Yahoo   News

Navient Corp

  NAVI   StockTA   Yahoo   News

T. Rowe Price Group I

  TROW   StockTA   Yahoo   News

Whirlpool Corporation

  WHR   StockTA   Yahoo   News
3 Bullish Crossing(s) today
-7 Bearish Crossing(s) today

Bullish comma separated list (upfile.txt)

Bearish comma separated list (downfile.txt)


VIX Indicator

VIX Value (12/30/2019) = 14.82

4 year historical Low

4 year historical High
9.1437.32


What is the VIX?


Distribution Charts

The current value is: 80

the median value: 59the median value: 66
4.0 Years364 Past Calendar Days

Trending Charts (Winning / Losing Streak)

The trend has changed to down today

4.0 Years364 Past Calendar Days

Copyright © 2007-2019 xsProfits All Rights Reserved | Privacy Policy__._,_.___


<*> To unsubscribe from this group, send an email to:
    brian@coxintl.com


xsProfits Website Investools Think Or Swim
10/20 day MA daily table 10/20 MA Breakout Bullish Percent Index


__,_._,___

Monday, December 30, 2019

Daily xs Indicator Report (beta)

81% are trading Bullish (Above 10/20 SMA)
last successfully ran 12/30/2019 at 06:09 PM
Upward direction stocks

Description

 Symbol StockTA Yahoo News

American Water Works

 AWK  StockTA   Yahoo   News

Church & Dwight Co.,

 CHD  StockTA   Yahoo   News

Cognizant Technology

 CTSH  StockTA   Yahoo   News

Intercontinental Exch

 ICE  StockTA   Yahoo   News

Public Storage

 PSA  StockTA   Yahoo   News

Ross Stores, Inc.

 ROST  StockTA   Yahoo   News

Textron Inc.

 TXT  StockTA   Yahoo   News

Ventas, Inc.

 VTR  StockTA   Yahoo   News
 
Downward direction stocks

Description

 Symbol StockTA  Yahoo News

Northern Trust Corpor

  NTRS   StockTA   Yahoo   News

Universal Health Serv

  UHS   StockTA   Yahoo   News
8 Bullish Crossing(s) today
-2 Bearish Crossing(s) today

Bullish comma separated list (upfile.txt)

Bearish comma separated list (downfile.txt)


VIX Indicator

VIX Value (12/27/2019) = 13.43

4 year historical Low

4 year historical High
9.1437.32


What is the VIX?


Distribution Charts

The current value is: 81

the median value: 59the median value: 66
4.0 Years364 Past Calendar Days

Trending Charts (Winning / Losing Streak)

The chart has been trending up for 10 days

4.0 Years364 Past Calendar Days

Copyright © 2007-2019 xsProfits All Rights Reserved | Privacy Policy__._,_.___


<*> To unsubscribe from this group, send an email to:
    brian@coxintl.com


xsProfits Website Investools Think Or Swim
10/20 day MA daily table 10/20 MA Breakout Bullish Percent Index


__,_._,___

Friday, December 27, 2019

Daily xs Indicator Report (beta)

80% are trading Bullish (Above 10/20 SMA)
last successfully ran 12/27/2019 at 06:09 PM
Upward direction stocks

Description

 Symbol StockTA Yahoo News

Akamai Technologies,

 AKAM  StockTA   Yahoo   News

Coca-Cola European Pa

 CCEP  StockTA   Yahoo   News

Foot Locker, Inc.

 FL  StockTA   Yahoo   News

Frontier Communicatio

 FTR  StockTA   Yahoo   News

H & R Block Inc

 HRB  StockTA   Yahoo   News

Northrop Grumman Corp

 NOC  StockTA   Yahoo   News
 
Downward direction stocks

Description

 Symbol StockTA  Yahoo News

Gilead Sciences, Inc.

  GILD   StockTA   Yahoo   News

Nucor Corporation

  NUE   StockTA   Yahoo   News

Ross Stores, Inc.

  ROST   StockTA   Yahoo   News

Unum Group

  UNM   StockTA   Yahoo   News
6 Bullish Crossing(s) today
-4 Bearish Crossing(s) today

Bullish comma separated list (upfile.txt)

Bearish comma separated list (downfile.txt)


VIX Indicator

VIX Value (12/26/2019) = 12.65

4 year historical Low

4 year historical High
9.1437.32


What is the VIX?


Distribution Charts

The current value is: 80

the median value: 59the median value: 65
4.0 Years364 Past Calendar Days

Trending Charts (Winning / Losing Streak)

The chart has been trending up for 9 days

4.0 Years364 Past Calendar Days

Copyright © 2007-2019 xsProfits All Rights Reserved | Privacy Policy__._,_.___


<*> To unsubscribe from this group, send an email to:
    brian@coxintl.com


xsProfits Website Investools Think Or Swim
10/20 day MA daily table 10/20 MA Breakout Bullish Percent Index


__,_._,___

Thursday, December 26, 2019

Daily xs Indicator Report (beta)

79% are trading Bullish (Above 10/20 SMA)
last successfully ran 12/26/2019 at 06:09 PM
Upward direction stocks

Description

 Symbol StockTA Yahoo News

American Internationa

 AIG  StockTA   Yahoo   News

Comcast Corporation

 CMCSA  StockTA   Yahoo   News

Citrix Systems, Inc.

 CTXS  StockTA   Yahoo   News

Dollar General Corp.

 DG  StockTA   Yahoo   News

Equifax Inc.

 EFX  StockTA   Yahoo   News

L Brands Inc

 LB  StockTA   Yahoo   News

Lockheed Martin Corpo

 LMT  StockTA   Yahoo   News

Paychex, Inc.

 PAYX  StockTA   Yahoo   News

Roper Technologies In

 ROP  StockTA   Yahoo   News
 
Downward direction stocks

Description

 Symbol StockTA  Yahoo News

Patterson Companies,

  PDCO   StockTA   Yahoo   News

Charles Schwab Corp

  SCHW   StockTA   Yahoo   News
9 Bullish Crossing(s) today
-2 Bearish Crossing(s) today

Bullish comma separated list (upfile.txt)

Bearish comma separated list (downfile.txt)


VIX Indicator

VIX Value (12/24/2019) = 12.67

4 year historical Low

4 year historical High
9.1437.32


What is the VIX?


Distribution Charts

The current value is: 79

the median value: 59the median value: 65
4.0 Years364 Past Calendar Days

Trending Charts (Winning / Losing Streak)

The chart has been trending up for 8 days

4.0 Years364 Past Calendar Days

Copyright © 2007-2019 xsProfits All Rights Reserved | Privacy Policy__._,_.___


<*> To unsubscribe from this group, send an email to:
    brian@coxintl.com


xsProfits Website Investools Think Or Swim
10/20 day MA daily table 10/20 MA Breakout Bullish Percent Index


__,_._,___

Tuesday, December 24, 2019

Daily xs Indicator Report (beta)

78% are trading Bullish (Above 10/20 SMA)
last successfully ran 12/24/2019 at 06:09 PM
Upward direction stocks

Description

 Symbol StockTA Yahoo News

American Airlines Gro

 AAL  StockTA   Yahoo   News

Automatic Data Proces

 ADP  StockTA   Yahoo   News

Amazon.com, Inc.

 AMZN  StockTA   Yahoo   News

Biogen Inc

 BIIB  StockTA   Yahoo   News

CIGNA Corporation

 CI  StockTA   Yahoo   News

Centene Corp

 CNC  StockTA   Yahoo   News

Dominion Resources, I

 D  StockTA   Yahoo   News

Quest Diagnostics Inc

 DGX  StockTA   Yahoo   News

Discovery Communicati

 DISCA  StockTA   Yahoo   News

Dollar Tree, Inc.

 DLTR  StockTA   Yahoo   News

General Electric Comp

 GE  StockTA   Yahoo   News

J B Hunt Transport Se

 JBHT  StockTA   Yahoo   News

Marathon Petroleum Co

 MPC  StockTA   Yahoo   News

Quanta Services Inc

 PWR  StockTA   Yahoo   News

Sherwin-Williams Co

 SHW  StockTA   Yahoo   News

Seagate Technology PL

 STX  StockTA   Yahoo   News

Constellation Brands,

 STZ  StockTA   Yahoo   News

Tyson Foods, Inc.

 TSN  StockTA   Yahoo   News

United Parcel Service

 UPS  StockTA   Yahoo   News

Valero Energy Corpora

 VLO  StockTA   Yahoo   News

Vulcan Materials Comp

 VMC  StockTA   Yahoo   News
 
Downward direction stocks

Description

 Symbol StockTA  Yahoo News

FedEx Corporation

  FDX   StockTA   Yahoo   News

Hormel Foods Corp

  HRL   StockTA   Yahoo   News

Stericycle Inc

  SRCL   StockTA   Yahoo   News
21 Bullish Crossing(s) today
-3 Bearish Crossing(s) today

Bullish comma separated list (upfile.txt)

Bearish comma separated list (downfile.txt)


VIX Indicator

VIX Value (12/23/2019) = 12.61

4 year historical Low

4 year historical High
9.1437.32


What is the VIX?


Distribution Charts

The current value is: 78

the median value: 59the median value: 65
4.0 Years364 Past Calendar Days

Trending Charts (Winning / Losing Streak)

The chart has been trending up for 7 days

4.0 Years364 Past Calendar Days

Copyright © 2007-2019 xsProfits All Rights Reserved | Privacy Policy__._,_.___


<*> To unsubscribe from this group, send an email to:
    brian@coxintl.com


xsProfits Website Investools Think Or Swim
10/20 day MA daily table 10/20 MA Breakout Bullish Percent Index


__,_._,___

Monday, December 23, 2019

Daily xs Indicator Report (beta)

74% are trading Bullish (Above 10/20 SMA)
last successfully ran 12/23/2019 at 06:09 PM
Upward direction stocks

Description

 Symbol StockTA Yahoo News

Air Products & Chemic

 APD  StockTA   Yahoo   News

salesforce.com, inc.

 CRM  StockTA   Yahoo   News

Discovery Communicati

 DISCK  StockTA   Yahoo   News

Corning Incorporated

 GLW  StockTA   Yahoo   News

Home Depot Inc

 HD  StockTA   Yahoo   News

Hewlett Packard Enter

 HPE  StockTA   Yahoo   News

Mallinckrodt PLC

 MNK  StockTA   Yahoo   News

Navient Corp

 NAVI  StockTA   Yahoo   News

Norfolk Southern Corp

 NSC  StockTA   Yahoo   News

Public Service Enterp

 PEG  StockTA   Yahoo   News

Southern Co

 SO  StockTA   Yahoo   News

Stryker Corporation

 SYK  StockTA   Yahoo   News

Teradata Corporation

 TDC  StockTA   Yahoo   News

Wells Fargo & Co

 WFC  StockTA   Yahoo   News
 
Downward direction stocks

Description

 Symbol StockTA  Yahoo News

AutoNation, Inc.

  AN   StockTA   Yahoo   News

Goodyear Tire & Rubbe

  GT   StockTA   Yahoo   News

International Paper C

  IP   StockTA   Yahoo   News

CarMax, Inc

  KMX   StockTA   Yahoo   News

PulteGroup, Inc.

  PHM   StockTA   Yahoo   News

Tyson Foods, Inc.

  TSN   StockTA   Yahoo   News

Vulcan Materials Comp

  VMC   StockTA   Yahoo   News
14 Bullish Crossing(s) today
-7 Bearish Crossing(s) today

Bullish comma separated list (upfile.txt)

Bearish comma separated list (downfile.txt)


VIX Indicator

VIX Value (12/20/2019) = 12.51

4 year historical Low

4 year historical High
9.1437.32


What is the VIX?


Distribution Charts

The current value is: 74

the median value: 59the median value: 65
4.0 Years364 Past Calendar Days

Trending Charts (Winning / Losing Streak)

The chart has been trending up for 6 days

4.0 Years364 Past Calendar Days

Copyright © 2007-2019 xsProfits All Rights Reserved | Privacy Policy__._,_.___


<*> To unsubscribe from this group, send an email to:
    brian@coxintl.com


xsProfits Website Investools Think Or Swim
10/20 day MA daily table 10/20 MA Breakout Bullish Percent Index


__,_._,___

Friday, December 20, 2019

Daily xs Indicator Report (beta)

72% are trading Bullish (Above 10/20 SMA)
last successfully ran 12/20/2019 at 06:09 PM
Upward direction stocks

Description

 Symbol StockTA Yahoo News

Advance Auto Parts, I

 AAP  StockTA   Yahoo   News

Anthem Inc

 ANTM  StockTA   Yahoo   News

Eversource Energy

 ES  StockTA   Yahoo   News

Fluor Corporation (NE

 FLR  StockTA   Yahoo   News

Global Payments Inc

 GPN  StockTA   Yahoo   News

Honeywell Internation

 HON  StockTA   Yahoo   News

Intel Corporation

 INTC  StockTA   Yahoo   News

Intuit Inc.

 INTU  StockTA   Yahoo   News

Netflix, Inc.

 NFLX  StockTA   Yahoo   News

NRG Energy Inc

 NRG  StockTA   Yahoo   News

Newell Brands Inc

 NWL  StockTA   Yahoo   News

Pinnacle West Capital

 PNW  StockTA   Yahoo   News
 
Downward direction stocks

Description

 Symbol StockTA  Yahoo News

American Water Works

  AWK   StockTA   Yahoo   News

Biogen Inc

  BIIB   StockTA   Yahoo   News

Frontier Communicatio

  FTR   StockTA   Yahoo   News

Macerich Co

  MAC   StockTA   Yahoo   News

O'Reilly Automotive I

  ORLY   StockTA   Yahoo   News

Progressive Corp

  PGR   StockTA   Yahoo   News

Wells Fargo & Co

  WFC   StockTA   Yahoo   News

DENTSPLY SIRONA Inc

  XRAY   StockTA   Yahoo   News
12 Bullish Crossing(s) today
-8 Bearish Crossing(s) today

Bullish comma separated list (upfile.txt)

Bearish comma separated list (downfile.txt)


VIX Indicator

VIX Value (12/19/2019) = 12.50

4 year historical Low

4 year historical High
9.1437.32


What is the VIX?


Distribution Charts

The current value is: 72

the median value: 59the median value: 65
4.0 Years364 Past Calendar Days

Trending Charts (Winning / Losing Streak)

The chart has been trending up for 5 days

4.0 Years364 Past Calendar Days

Copyright © 2007-2019 xsProfits All Rights Reserved | Privacy Policy__._,_.___


<*> To unsubscribe from this group, send an email to:
    brian@coxintl.com


xsProfits Website Investools Think Or Swim
10/20 day MA daily table 10/20 MA Breakout Bullish Percent Index


__,_._,___