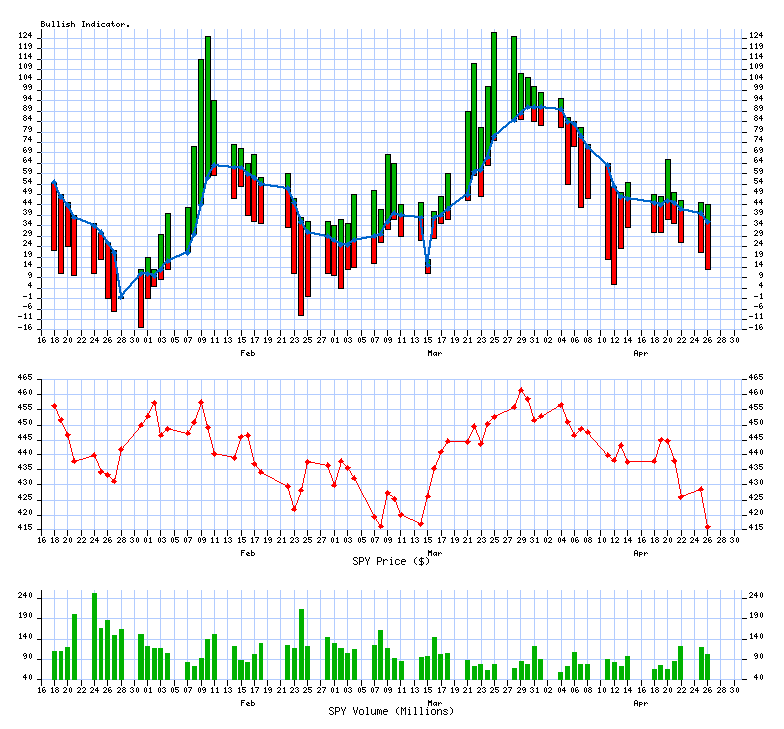
| 36% are trading Bullish (Above 10/20 SMA) | ||||||||
| last successfully ran 04/26/2022 at 06:05 PM | ||||||||
| Upward direction stocks | ||||||||
Description | Symbol | StockTA | Yahoo | News | ||||
Allegion PLC | ALLE | StockTA | Yahoo | News | ||||
Best Buy Co Inc | BBY | StockTA | Yahoo | News | ||||
Cerner Corporation | CERN | StockTA | Yahoo | News | ||||
Howmet Aerospace Inc | HWM | StockTA | Yahoo | News | ||||
Gartner Inc | IT | StockTA | Yahoo | News | ||||
MGM Resorts Internati | MGM | StockTA | Yahoo | News | ||||
M&T Bank Corporation | MTB | StockTA | Yahoo | News | ||||
Walgreens Boots Allia | WBA | StockTA | Yahoo | News | ||||
| Downward direction stocks | ||||||||
Description | Symbol | StockTA | Yahoo | News | ||||
AFLAC Incorporated | AFL | StockTA | Yahoo | News | ||||
Allstate Corp | ALL | StockTA | Yahoo | News | ||||
Aon PLC | AON | StockTA | Yahoo | News | ||||
Becton Dickinson and | BDX | StockTA | Yahoo | News | ||||
Centene Corp | CNC | StockTA | Yahoo | News | ||||
Dominion Energy Inc | D | StockTA | Yahoo | News | ||||
EOG Resources Inc | EOG | StockTA | Yahoo | News | ||||
Fidelity National Inf | FIS | StockTA | Yahoo | News | ||||
Jack Henry & Associat | JKHY | StockTA | Yahoo | News | ||||
Kroger Co | KR | StockTA | Yahoo | News | ||||
Laboratory Corp. of A | LH | StockTA | Yahoo | News | ||||
L3Harris Technologies | LHX | StockTA | Yahoo | News | ||||
Eli Lilly And Co | LLY | StockTA | Yahoo | News | ||||
Alliant Energy Corpor | LNT | StockTA | Yahoo | News | ||||
Lumen Technologies In | LUMN | StockTA | Yahoo | News | ||||
Metlife Inc | MET | StockTA | Yahoo | News | ||||
Newmont Corporation | NEM | StockTA | Yahoo | News | ||||
Nielsen Holdings PLC | NLSN | StockTA | Yahoo | News | ||||
Northrop Grumman Corp | NOC | StockTA | Yahoo | News | ||||
Principal Financial G | PFG | StockTA | Yahoo | News | ||||
Raymond James Financi | RJF | StockTA | Yahoo | News | ||||
T-Mobile Us Inc | TMUS | StockTA | Yahoo | News | ||||
Zimmer Biomet Holding | ZBH | StockTA | Yahoo | News | ||||
Bullish comma separated list (upfile.txt) | ||||||||
Bearish comma separated list (downfile.txt) | ||||||||
| ||||||||
VIX Indicator | ||||||||
VIX Value (03/05/2021) = 24.66 | ||||||||
| 4 year historical Low | 4 year historical High | |||||||
| 10.85 | 82.69 | |||||||

Distribution Charts | |
The current value is: 36 | |
| the median value: 60 | the median value: 56 |
| 4.0 Years | 364 Past Calendar Days |
Trending Charts (Winning / Losing Streak) | |
The chart has been trending down for 4 days | |
| 4.0 Years | 364 Past Calendar Days |
__._,_.___
<*> To unsubscribe from this group, send an email to:
brian@coxintl.com
| xsProfits Website | ThinkOrSwim | |
| 10/20 day MA daily table | 10/20 MA Breakout | Bullish Percent Index |
__,_._,___
No comments:
Post a Comment