| 20% are trading Bullish (Above 10/20 SMA) | ||||||||
| last successfully ran 09/22/2016 at 06:05 PM | ||||||||
| Upward direction stocks | ||||||||
Description | Symbol | StockTA | Yahoo | News | ||||
Baxter International | BAX | StockTA | Yahoo | News | ||||
Celgene Corporation | CELG | StockTA | Yahoo | News | ||||
Dominion Resources, I | D | StockTA | Yahoo | News | ||||
DaVita HealthCare Par | DVA | StockTA | Yahoo | News | ||||
Eversource Energy | ES | StockTA | Yahoo | News | ||||
FLIR Systems, Inc. | FLIR | StockTA | Yahoo | News | ||||
Intuitive Surgical, I | ISRG | StockTA | Yahoo | News | ||||
Mallinckrodt PLC | MNK | StockTA | Yahoo | News | ||||
NVIDIA Corporation | NVDA | StockTA | Yahoo | News | ||||
UnitedHealth Group In | UNH | StockTA | Yahoo | News | ||||
Wal-Mart Stores, Inc. | WMT | StockTA | Yahoo | News | ||||
| Downward direction stocks | ||||||||
Description | Symbol | StockTA | Yahoo | News | ||||
Assurant, Inc. | AIZ | StockTA | Yahoo | News | ||||
BorgWarner Inc. | BWA | StockTA | Yahoo | News | ||||
CBS Corporation | CBS | StockTA | Yahoo | News | ||||
Citizens Financial Gr | CFG | StockTA | Yahoo | News | ||||
eBay Inc | EBAY | StockTA | Yahoo | News | ||||
Entergy Corporation | ETR | StockTA | Yahoo | News | ||||
Goldman Sachs Group I | GS | StockTA | Yahoo | News | ||||
HCA Holdings Inc | HCA | StockTA | Yahoo | News | ||||
Kinder Morgan Inc | KMI | StockTA | Yahoo | News | ||||
Southwest Airlines Co | LUV | StockTA | Yahoo | News | ||||
Moody's Corporation | MCO | StockTA | Yahoo | News | ||||
Netflix, Inc. | NFLX | StockTA | Yahoo | News | ||||
ONEOK, Inc. | OKE | StockTA | Yahoo | News | ||||
Phillips 66 | PSX | StockTA | Yahoo | News | ||||
State Street Corp | STT | StockTA | Yahoo | News | ||||
Southwestern Energy C | SWN | StockTA | Yahoo | News | ||||
Zions Bancorp | ZION | StockTA | Yahoo | News | ||||
Bullish comma separated list (upfile.txt) | ||||||||
Bearish comma separated list (downfile.txt) | ||||||||
| ||||||||
VIX Indicator | ||||||||
VIX Value (09/22/2016) = 12.02 | ||||||||
| 4 year historical Low | 4 year historical High | |||||||
| 10.28 | 53.29 | |||||||
Distribution Charts | |
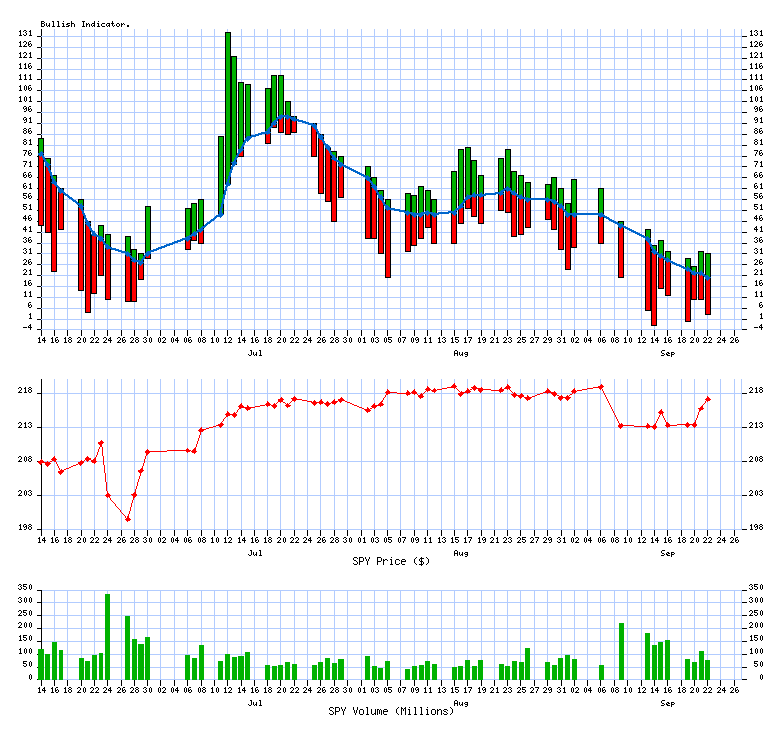
The current value is: 20 | |
| the median value: 56 | the median value: 56 |
| 4.0 Years | 364 Past Calendar Days |
Trending Charts (Winning / Losing Streak) | |
The chart has been trending down for 18 days | |
| 4.0 Years | 364 Past Calendar Days |
__._,_.___
<*> To unsubscribe from this group, send an email to:
brian@coxintl.com
| xsProfits Website | Investools | Think Or Swim |
| 10/20 day MA daily table | 10/20 MA Breakout | Bullish Percent Index |
__,_._,___
No comments:
Post a Comment